


Our team has over 7,000,000 traders!
Every day we work together to improve trading. We get high results and move forward.
Recognition by millions of traders all over the world is the best appreciation of our work! You made your choice and we will do everything it takes to meet your expectations!
We are a great team together!
InstaSpot. Proud to work for you!


Actor, UFC 6 tournament champion and a true hero!
The man who made himself. The man that goes our way.
The secret behind Taktarov's success is constant movement towards the goal.
Reveal all the sides of your talent!
Discover, try, fail - but never stop!
InstaSpot. Your success story starts here!

Last week ended with a semi-empty macroeconomic calendar, the only thing that was published was data on Existing Home Sales in the U.S. The indicators came out at the close of the European session and were not particularly important on the market.
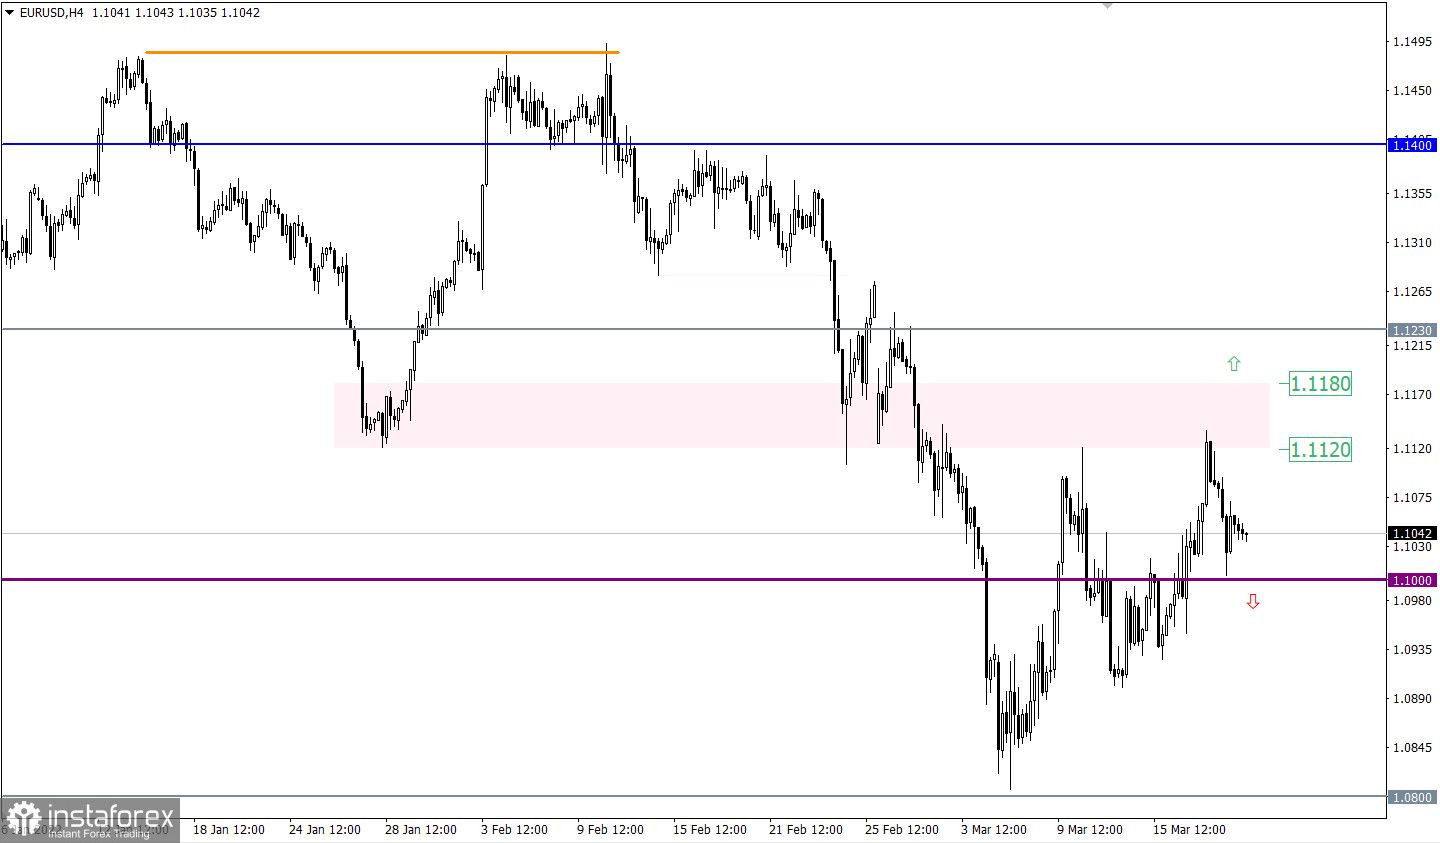
The EURUSD currency pair once again reduced the volume of long positions in the resistance area of 1.1120/1.1180. This led to a rebound in prices and a partial recovery of dollar positions. Relative to market cycles, the quote is in a medium-term downward trend, in the structure of which a corrective move has occurred.
The GBPUSD currency pair has been moving within the 1.3180/1.3200 resistance area for the third day in a row. This led to a slowdown in the corrective course and, as a result, a stage of stagnation. Regarding medium-term cycles, the downward trend from June 2021 continues on the market, where the psychological level of 1.3000 serves as support.
Monday is traditionally accompanied by an empty macroeconomic calendar. Nevertheless, stable information and news flow will continue to play on the nerves of speculators, which allows for new jumps in the market.
The process of restoring dollar positions is still relevant in the market. The strengthening of the downward move may occur when the price is kept below the value of 1.0990. In this case, movement in the direction of 1.0900–1.0800 is not excluded.
An alternative market development scenario will be considered by traders if the price holds above 1.1200 in a four-hour period.
The stagnation stage will soon end, where the existing amplitude of 1.3100/1.3200 will play the role of a lever for speculators. In this case, the most optimal trading strategy is the method of breaking through one or another stagnation border.
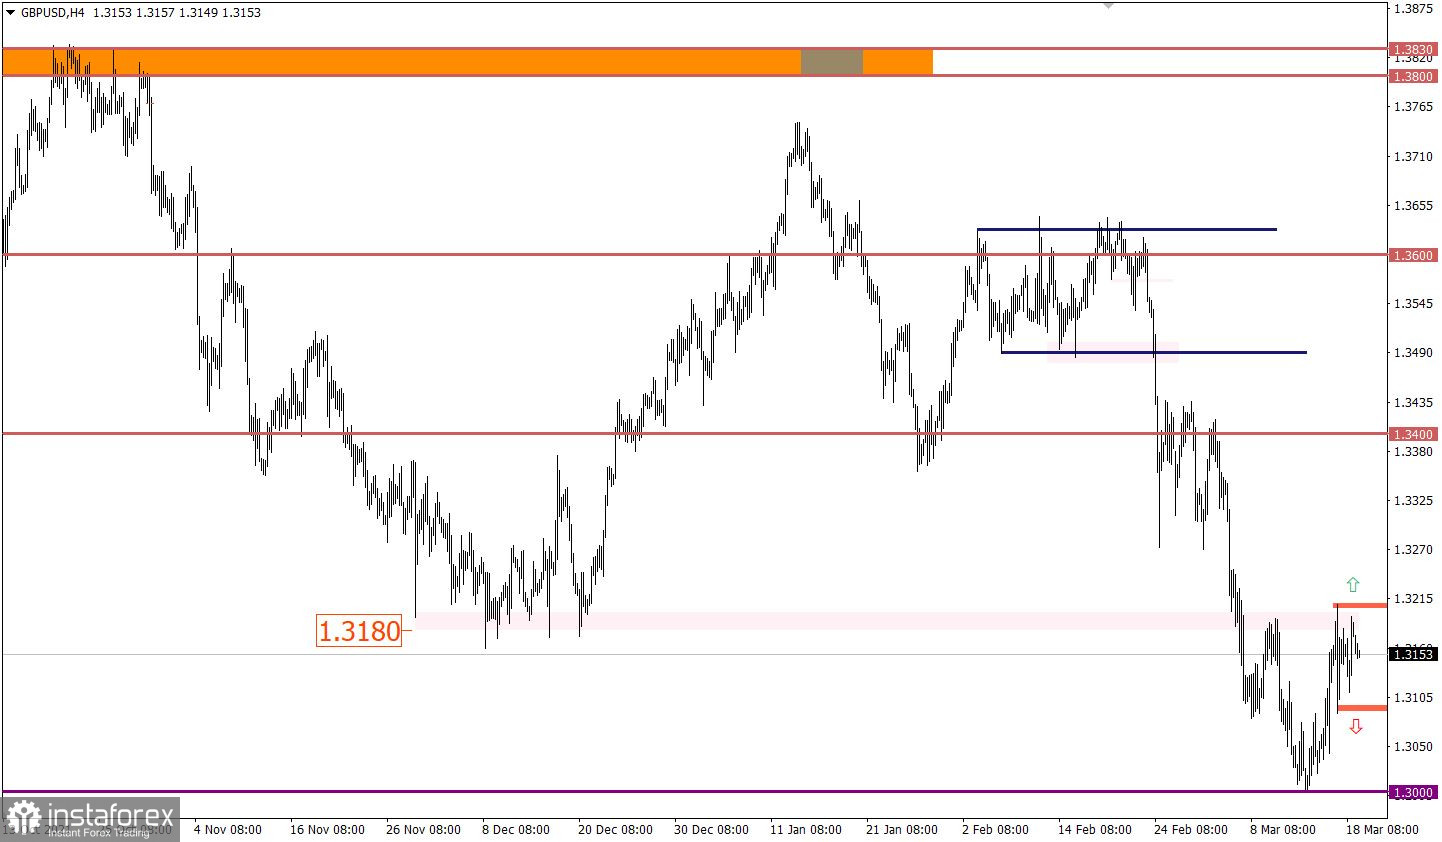
We concretize the above into trading signals:
Buy positions on the currency pair are taken into account after holding the price above the value of 1.3210 in a four-hour period with the prospect of a move to 1.3285.
Sell positions should be considered after holding the price below 1.3080 with the prospect of a move to 1.3000.
A candlestick chart view is graphical rectangles of white and black light, with sticks on top and bottom. When analyzing each candle in detail, you will see its characteristics of a relative period: the opening price, closing price, and maximum and minimum prices.
Horizontal levels are price coordinates, relative to which a stop or a price reversal may occur. These levels are called support and resistance in the market.
Circles and rectangles are highlighted examples where the price of the story unfolded. This color selection indicates horizontal lines that may put pressure on the quote in the future.
The up/down arrows are the reference points of the possible price direction in the future.
*The market analysis posted here is meant to increase your awareness, but not to give instructions to make a trade.
InstaSpot analytical reviews will make you fully aware of market trends! Being an InstaSpot client, you are provided with a large number of free services for efficient trading.


