


Our team has over 7,000,000 traders!
Every day we work together to improve trading. We get high results and move forward.
Recognition by millions of traders all over the world is the best appreciation of our work! You made your choice and we will do everything it takes to meet your expectations!
We are a great team together!
InstaSpot. Proud to work for you!


Actor, UFC 6 tournament champion and a true hero!
The man who made himself. The man that goes our way.
The secret behind Taktarov's success is constant movement towards the goal.
Reveal all the sides of your talent!
Discover, try, fail - but never stop!
InstaSpot. Your success story starts here!

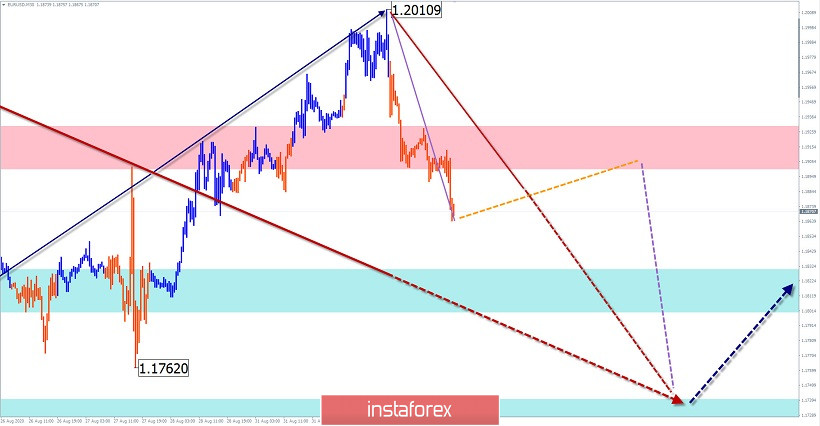
EUR/USD
Analysis:
An upward trend has been forming on the chart of the European currency since March 23. The price reached a strong reversal zone. Since the end of July, quotes form a counter correction. The current configuration of this wave most closely resembles a shifting plane. The movement has entered its final phase.
Forecast:
In the current day, the general downward mood of the movement is expected. In the European session, a short-term increase in the resistance area is not excluded. If the nearest support breaks through, the decline may continue to the next zone.
Potential reversal zones
Resistance:
- 1.1900/1.1930
Support:
- 1.1830/1.1800
- 1.1740/1.1710
Recommendations:
Until the current correction is completed, trading on the euro market can only be successful within the intraday. Today, the priority is to sell the pair.
USD/JPY
Analysis:
The chart of the Japanese yen is dominated by a downward wave from July 5. The last section of the trend starts on August 12. The structure of this wave shows a clear zigzag. In the last days of August, a counter-pullback began in the final part (C).
Forecast:
Today, the general flat mood of the pair's movement is expected. In the next session, we can expect the price rise to continue. In the area of the resistance zone, the probability of a reversal and a downward movement of the price increases.
Potential reversal zones
Resistance:
- 106.30/106.60
Support:
- 105.60/105.30
Recommendations:
Trading on the pair's market is possible within the intra-session style. When buying, you should take into account the limited potential for a possible rise. After the appearance of clear reversal signals, the pair's sales will become relevant.

Explanation: In the simplified wave analysis (UVA), waves consist of 3 parts (A-B-C). The last incomplete wave is analyzed. The solid background of the arrows shows the formed structure, and the dotted one shows the expected movements.
Note: The wave algorithm does not take into account the duration of the tool's movements in time!
*The market analysis posted here is meant to increase your awareness, but not to give instructions to make a trade.
InstaSpot analytical reviews will make you fully aware of market trends! Being an InstaSpot client, you are provided with a large number of free services for efficient trading.


