


The legend in the InstaSpot team!
Legend! You think that's bombastic rhetoric? But how should we call a man, who became the first Asian to win the junior world chess championship at 18 and who became the first Indian Grandmaster at 19? That was the start of a hard path to the World Champion title for Viswanathan Anand, the man who became a part of history of chess forever. Now one more legend in the InstaSpot team!


Borussia is one of the most titled football clubs in Germany, which has repeatedly proved to fans: the spirit of competition and leadership will certainly lead to success. Trade in the same way that sports professionals play the game: confidently and actively. Keep a "pass" from Borussia FC and be in the lead with InstaSpot!

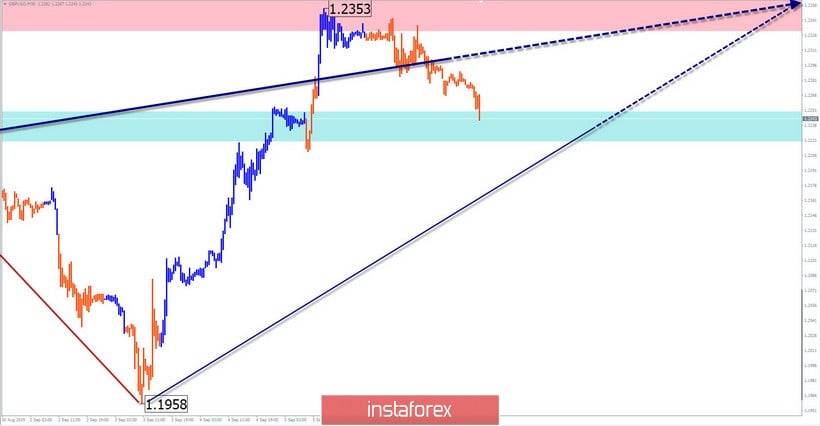
GBP/USD
The direction of the short-term trend of the British currency since the end of July forms an upward stretched plane. Since September 3, the final stage of the movement has been developing. The price has reached the minimum level of elongation at which the completion of the entire wave is already possible.
Forecast:
There are no reversal signals on the chart, which indicates a high probability of continuing the price increase. Previously, you can count up to 3 figures up from the current rate. Today is expected to complete the current decline in recent days, a reversal and the beginning of growth. Before the change of rate, a short-term puncture of the lower border of the support zone is not excluded.
Recommendations:
In the current reversal zone, it is recommended to start tracking reversal signals to find entry points to long positions for this instrument.
Resistance zone:
- 1.2330/1.2360
Support zone:
- 1.2250/1.2220
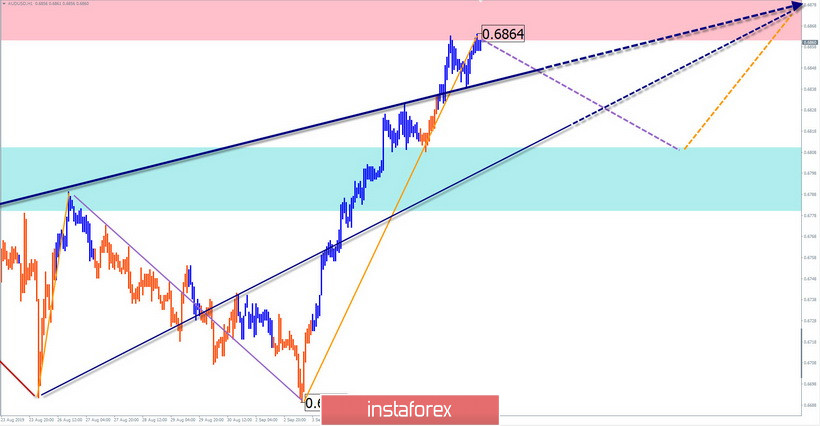
AUD/USD
On the chart of the Australian, an upward wave continues to develop. Its structure until the last stage was formed as a standard plane, but the final rise of September 3 turned it into a stretched one. The price reached a strong resistance.
Forecast:
At the next trading sessions, a pullback is expected. The probability of a "sideways" in the narrow price range remains. A return to the main rate can be expected at the end of the day or tomorrow.
Recommendations:
Aussie sales can be risky. It is wiser to refrain from trading during the upcoming rollback and at its end look for signals to buy the pair.
Resistance zone:
- 0.6860/0.6890
Support zone:
- 0.6810/0.6780
Explanations to figures: Waves in the simplified wave analysis (UVA) consist of 3 parts (A-B-C). Analyzes the last unfinished wave. Zones show the areas with the highest probability of reversal. Arrows indicate the wave count used by the author to the method, a solid background structure for determining the expected movement.
Attention: The wave algorithm does not take into account the length of time the instrument moves.
*The market analysis posted here is meant to increase your awareness, but not to give instructions to make a trade.
InstaSpot analytical reviews will make you fully aware of market trends! Being an InstaSpot client, you are provided with a large number of free services for efficient trading.


