


Our team has over 7,000,000 traders!
Every day we work together to improve trading. We get high results and move forward.
Recognition by millions of traders all over the world is the best appreciation of our work! You made your choice and we will do everything it takes to meet your expectations!
We are a great team together!
InstaSpot. Proud to work for you!


Actor, UFC 6 tournament champion and a true hero!
The man who made himself. The man that goes our way.
The secret behind Taktarov's success is constant movement towards the goal.
Reveal all the sides of your talent!
Discover, try, fail - but never stop!
InstaSpot. Your success story starts here!

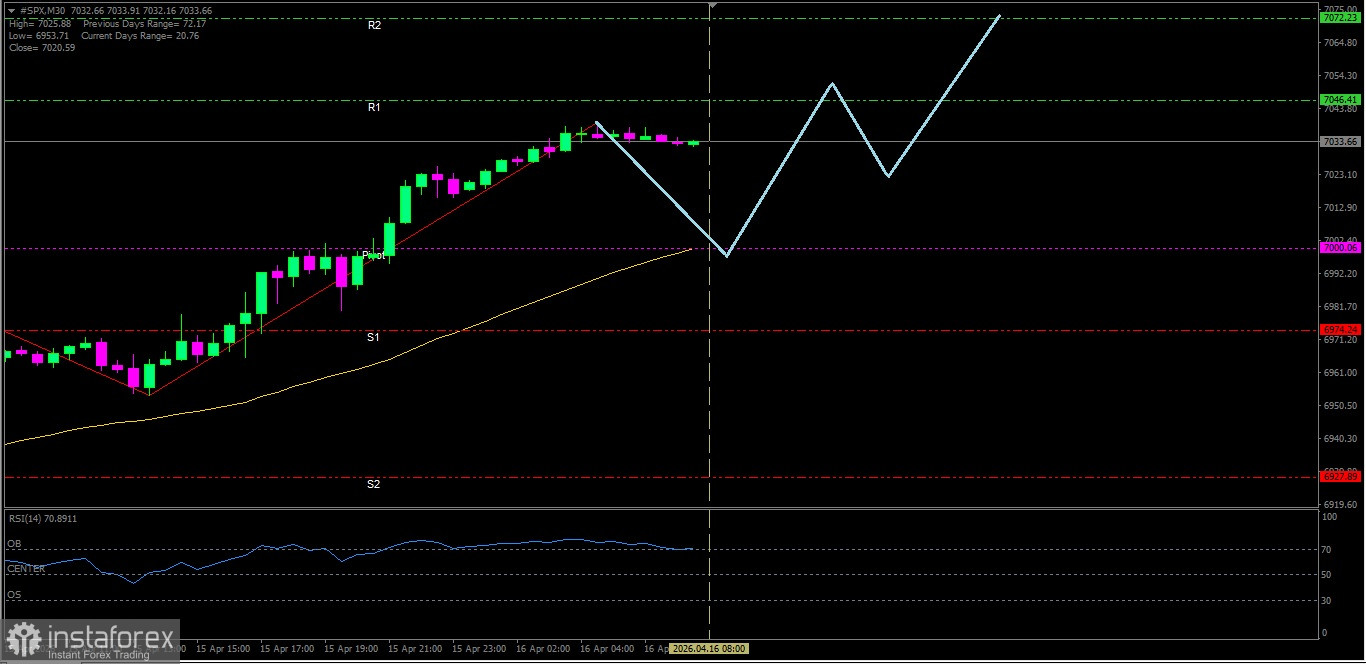
#SPX
With EMA(50) and EMA(200) position forming a Golden Cross and confirmed by RSI(14) indicator in the Extreme-Bullish level, there is potential today for #SPX to test its nearest resistance level.
Key Levels
1. Resistance. 2 : 7072.23
2. Resistance. 1 : 7046.41
3. Pivot : 7000.06
4. Support. 1 : 6974.24
5. Support. 2 : 6927.89
Tactical Scenario
Positive Reaction Zone: If #SPX breaks out and closes above 6974.24, there is a likelihood the move will rise toward 7072.23.
Momentum Extension Bias: If 7072.23 is broken to the upside, #SPX may test 7118.58.
Invalidation Level / Bias Revision
The upside bias weakens if #SPX plunges below 6927.89.
Technical Summary
EMA(50) : 6998.49
EMA(200): 6897.29
RSI(14) : 70.30
Economic News Release Agenda:
Today the United States will release the following economic data:
US - Philly Fed Manufacturing Index - 19:30 WIB
US - Unemployment Claims - 19:30 WIB
US - Capacity Utilization Rate - 20:15 WIB
US - Industrial Production m/m - 20:15 WIB
US - Natural Gas Storage - 21:30 WIB
*The market analysis posted here is meant to increase your awareness, but not to give instructions to make a trade.
InstaSpot analytical reviews will make you fully aware of market trends! Being an InstaSpot client, you are provided with a large number of free services for efficient trading.


