


The legend in the InstaSpot team!
Legend! You think that's bombastic rhetoric? But how should we call a man, who became the first Asian to win the junior world chess championship at 18 and who became the first Indian Grandmaster at 19? That was the start of a hard path to the World Champion title for Viswanathan Anand, the man who became a part of history of chess forever. Now one more legend in the InstaSpot team!


Borussia is one of the most titled football clubs in Germany, which has repeatedly proved to fans: the spirit of competition and leadership will certainly lead to success. Trade in the same way that sports professionals play the game: confidently and actively. Keep a "pass" from Borussia FC and be in the lead with InstaSpot!
The UK retail sales data turned out to be quite alarming that the pound immediately started to fall after this report. This is not surprising, as instead of accelerating from 0.2% to 1.5%, retail sales fell to -2.4%. However, a few hours after the opening of the U.S. trading session, not only did the pound pare its losses but it also managed to completely recover. The British currency suddenly received support. Usually, data on existing home sales in the United States does not have a significant impact on the market. The only exception is when the data shows a sharp change compared to the previous period. And this is exactly what happened. Sales were expected to rise by 0.3%, but they actually plummeted to -1.0%. So not only did they not grow, but the decline was also quite significant. Today, the market is likely to consolidate around current levels. The reason behind this is the empty economic calendar for Monday. And perhaps this is for the better because the European Central Bank's meeting is scheduled for Thursday. So the market has some time to reflect and prepare for this significant event. If there are no unexpected and major news developments, the market will likely remain stagnant.
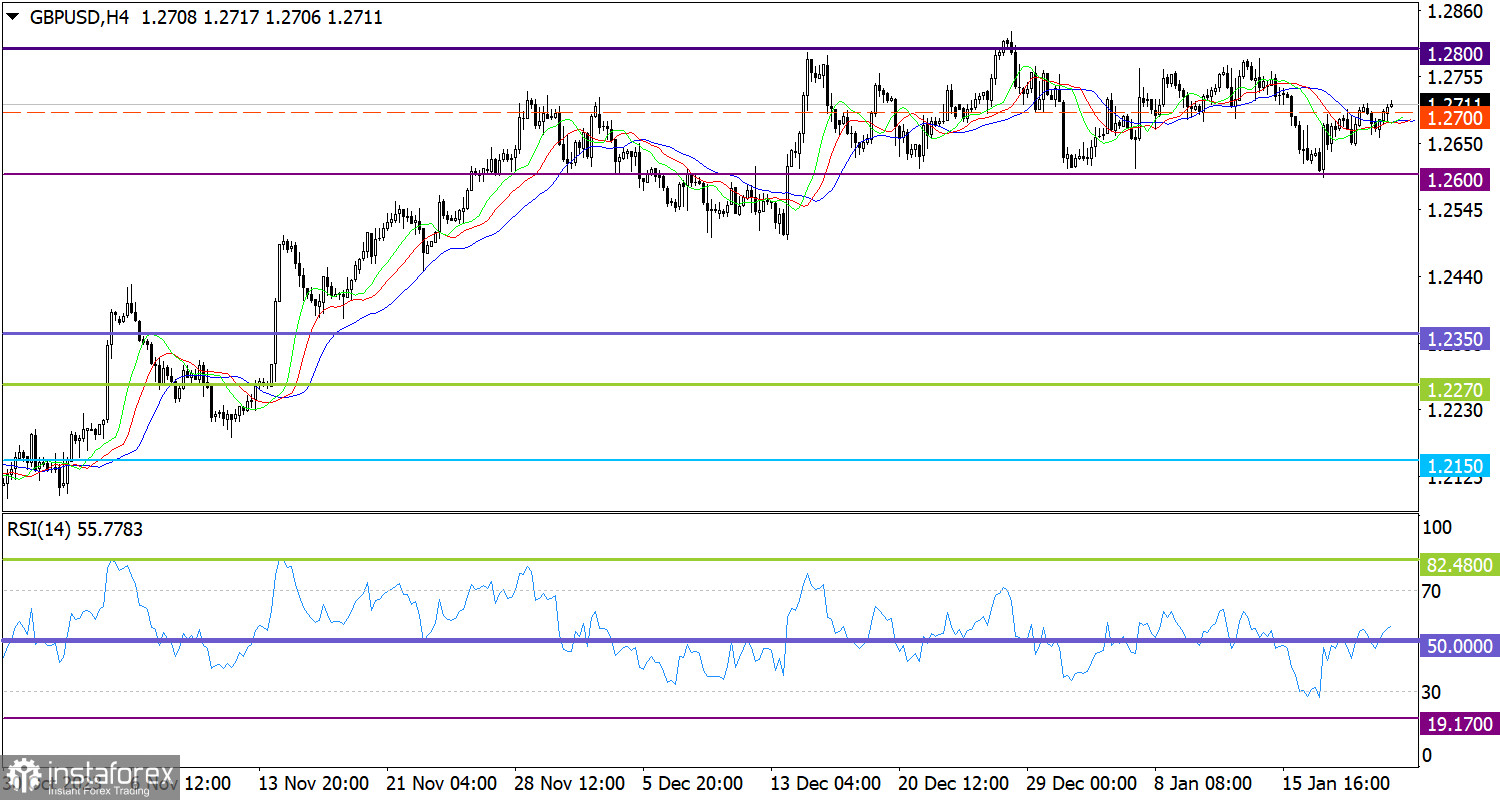
GBP/USD is moving within a five-week sideways channel between 1.2600 and 1.2800, consistently testing these boundaries. Currently, the price is stable above the middle level of 1.2700, indicating an increase in long positions within the range.
On the 4-hour chart, we observed a similar cycle of movement from the RSI indicator, corresponding to price fluctuations within the sideways channel. Initially, the indicator nearly reached a low RSI level below 30, which indicates an oversold condition. Afterwards, a rebound followed. Currently, the indicator is moving above 50, indicating an increase in long positions.
Meanwhile, the Alligator's MAs are intertwined in the 4-hour chart. However, this consolidation only reflects a change in the cycle within the channel.
In this situation, you may consider trading within the boundaries of the sideways channel, as the price could move towards the upper boundary of the channel at 1.2800.
However, it is important to remember that a sideways channel represents a temporary price pattern that leads to significant attention from speculators. Eventually, there will be impulsive moves that will signal the end of the channel and indicate the subsequent market direction. For this reason, it's advisable to consider breakout strategies.
Complex indicator analysis suggests a bullish bias within the channel's structure in the short-term and intraday periods.
*这里的市场分析是为了增加您对市场的了解,而不是给出交易的指示。
InstaSpot分析评论将让您充分了解市场趋势! 作为InstaSpot的客户,您将获得大量的免费服务以实现有效的交易。


