


فريقنا لديه أكثر من 7,000,000 من التجار!
كل يوم نعمل معا لتحسين التداول. نحصل على نتائج عالية ونمضي قدما.
الاعتراف من قبل الملايين من التجار في جميع أنحاء العالم هو أفضل تقدير لعملنا! لقد قمت باختيارك وسنفعل كل ما يلزم لتلبية توقعاتك!
نحن فريق رائع معا!
إنستافوركس تعتز بالعمل بالنسبة لك!


الممثل وبطل مسابقة يو إف سي 6 وبطل حقيقي!
الرجل الذي حقق النجاح بعمله الدؤوب. الرجل الذي يذهب كما نريد.
سر نجاح تاكتاروف هو حركة مستمرة نحو الهدف.
اكشف عن جميع جوانب موهبتك!
اكتشف، وحاول، وافشل - ولكن لا تتوقف أبدا!
إنستافوركس. تبدأ قصة نجاحك من هنا!
The UK retail sales data turned out to be quite alarming that the pound immediately started to fall after this report. This is not surprising, as instead of accelerating from 0.2% to 1.5%, retail sales fell to -2.4%. However, a few hours after the opening of the U.S. trading session, not only did the pound pare its losses but it also managed to completely recover. The British currency suddenly received support. Usually, data on existing home sales in the United States does not have a significant impact on the market. The only exception is when the data shows a sharp change compared to the previous period. And this is exactly what happened. Sales were expected to rise by 0.3%, but they actually plummeted to -1.0%. So not only did they not grow, but the decline was also quite significant. Today, the market is likely to consolidate around current levels. The reason behind this is the empty economic calendar for Monday. And perhaps this is for the better because the European Central Bank's meeting is scheduled for Thursday. So the market has some time to reflect and prepare for this significant event. If there are no unexpected and major news developments, the market will likely remain stagnant.
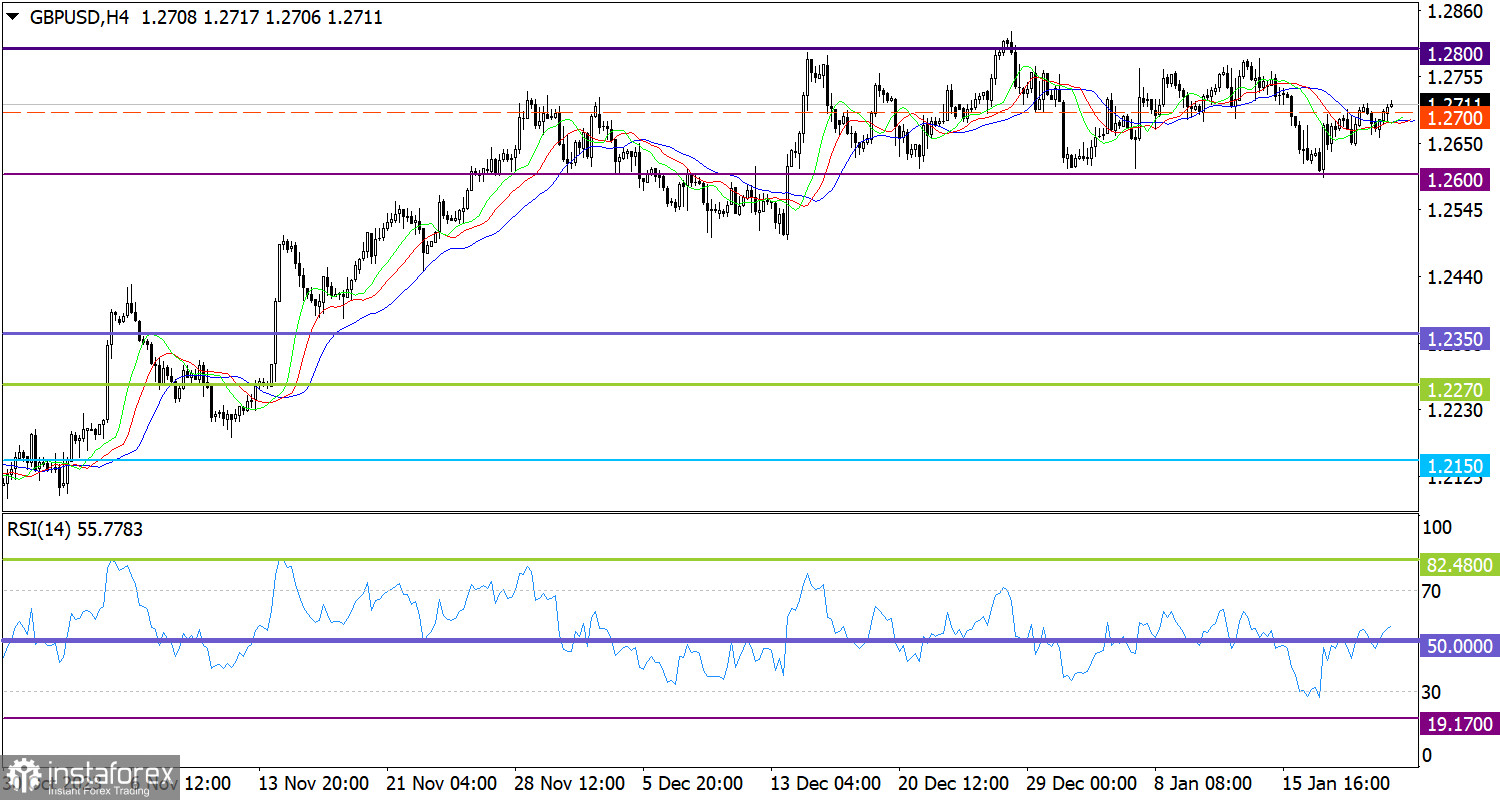
GBP/USD is moving within a five-week sideways channel between 1.2600 and 1.2800, consistently testing these boundaries. Currently, the price is stable above the middle level of 1.2700, indicating an increase in long positions within the range.
On the 4-hour chart, we observed a similar cycle of movement from the RSI indicator, corresponding to price fluctuations within the sideways channel. Initially, the indicator nearly reached a low RSI level below 30, which indicates an oversold condition. Afterwards, a rebound followed. Currently, the indicator is moving above 50, indicating an increase in long positions.
Meanwhile, the Alligator's MAs are intertwined in the 4-hour chart. However, this consolidation only reflects a change in the cycle within the channel.
In this situation, you may consider trading within the boundaries of the sideways channel, as the price could move towards the upper boundary of the channel at 1.2800.
However, it is important to remember that a sideways channel represents a temporary price pattern that leads to significant attention from speculators. Eventually, there will be impulsive moves that will signal the end of the channel and indicate the subsequent market direction. For this reason, it's advisable to consider breakout strategies.
Complex indicator analysis suggests a bullish bias within the channel's structure in the short-term and intraday periods.
*The market analysis posted here is meant to increase your awareness, but not to give instructions to make a trade.
InstaSpot analytical reviews will make you fully aware of market trends! Being an InstaSpot client, you are provided with a large number of free services for efficient trading.


