


我们的团队有超过700万的操盘手!
我们每天都在一起努力改善交易。我们得到了很高的成绩,并继续前进。
世界各地数以百万计的操盘手的认可是我们工作的最大赞赏! 您做出了您的选择,我们将尽一切努力来满足您的期望!
我们是一个共同的伟大团队!
InstaSpot. 自豪地为您工作!


EUR/USD
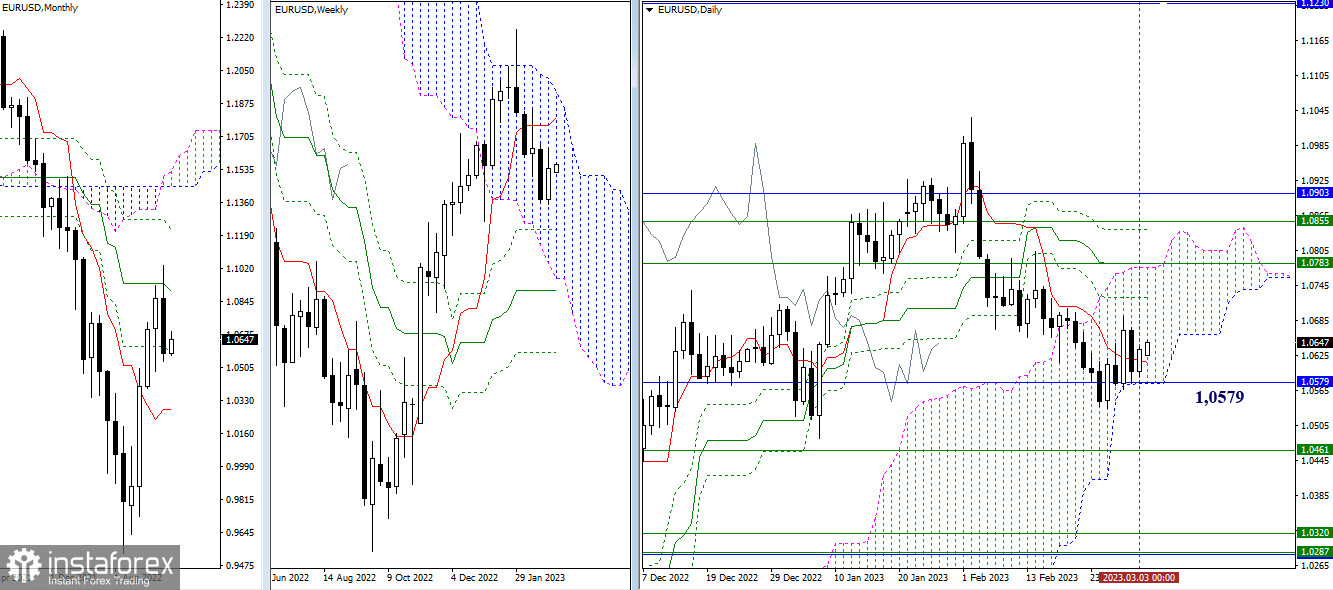
Higher time frames
For the whole past week, the pair was trading near the monthly support level of 1.0579. The bearish sentiment that was prevailing in February did not continue in the first days of March. At the moment, the pair is holding above the monthly support level, and the daily short-term trend level of 1.0612 also confirmed the bullish trend. In case the bullish bias intensifies further, the pair will be trading in a wide range formed by the resistance levels of daily, weekly, and monthly time frames (1.0724 – 1.0783 – 1.0855 – 1.0903). If the price settles above the extremum point of 1.1033 and retests it, it may then head for new upward targets. On the other hand, if the pair leaves the daily Ichimoku Cloud and enters the selling zone by overcoming the monthly support of 1.0579, it may form a new breakout and move towards the weekly Fibo Kijun level of 1.0461 and the area of 1.0284 – 1.0320 (lower line of the weekly cloud + weekly medium-term trend + monthly short-term trend).
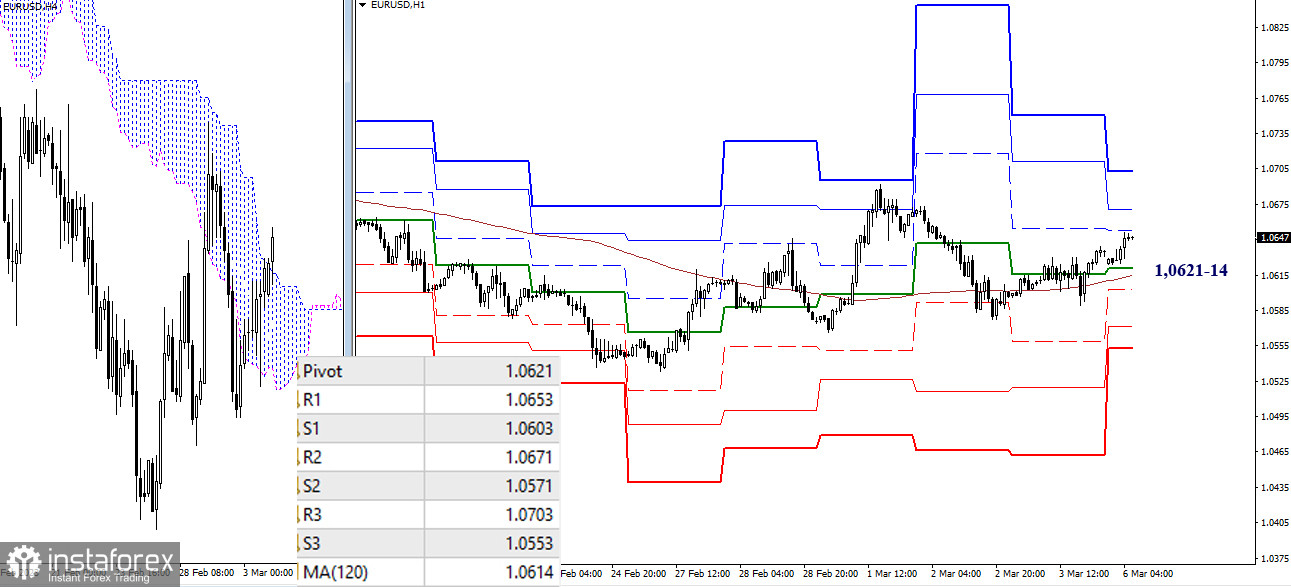
H4 – H1
At the moment of writing, the pair was trading above the key levels on lower time frames. Today, the key levels are found in the narrow range of 1.0621-14 (central daily pivot level + weekly long-term trend). Trading above this area favors the bullish trend. The next upward targets on the intraday chart are seen at 1.0653 – 1.0671 – 1.0703 (standard pivot levels). If bulls lose control of these levels, the market sentiment will change on shorter time frames. If so, traders will focus on the downward targets represented by support levels of 1.0603 – 1.0571 – 1.0553.
***
GBP/USD
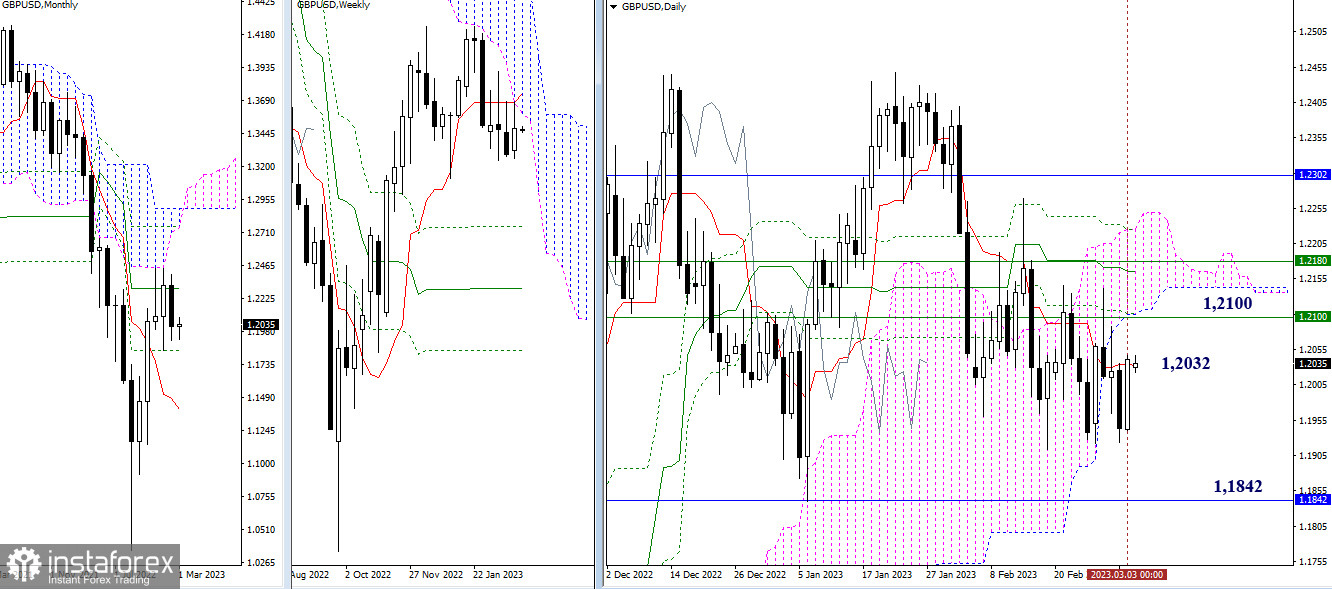
Higher time frames
The pair remained in the consolidation phase in the course of the previous week. The market uncertainty is still high. The daily short-term trend level of 1.2032 remains the key level for today. To change the market situation, the pair should leave the consolidation zone. Bears may see a way to develop a downward movement if the price settles firmly below the monthly support of 1.1842. In the current conditions, buyers will need to break above the resistance levels of different time frames (1,2100 – 1,2180 – 1,2302)to recover and maintain the current trend.
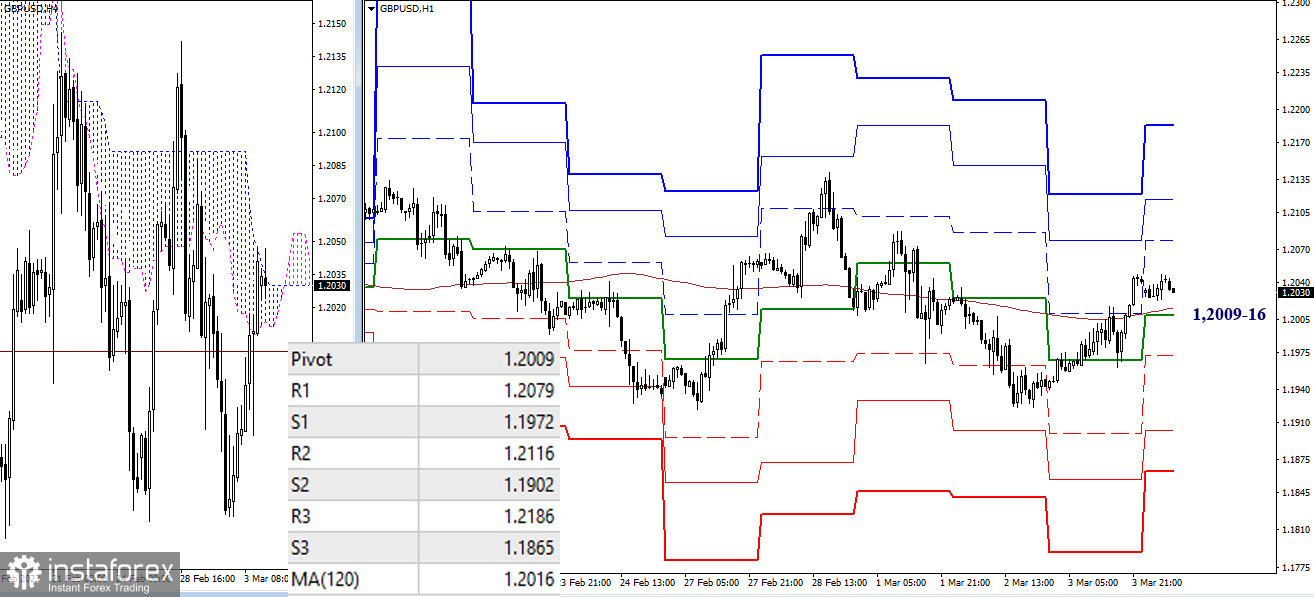
H4 – H1
On lower time frames, the pair has broken above the key levels of 1.2009-16 (central daily pivot level + weekly long-term trend). More intraday upside targets are located in the area of 1.2079 – 1.2116 – 1.2186 formed by the resistance of standard pivot levels. The support area represented by standard pivot levels can be seen at 1.1972 – 1.1902 – 1.1865. The pair may head this way when the market sentiment changes and the price settles firmly below 1.2009-16.
***
Technical analysis is based on:
Higher time frames – Ichimoku Kinko Hyo (9.26.52) + Fibo Kijun levels
Lower time frames – H1: Pivot Points (standard) + 120-day Moving Average (weekly long-term trend)
*这里的市场分析是为了增加您对市场的了解,而不是给出交易的指示。
InstaSpot分析评论将让您充分了解市场趋势! 作为InstaSpot的客户,您将获得大量的免费服务以实现有效的交易。


