


Huyền thoại trong nhóm InstaSpot!
Huyền thoại! Bạn nghĩ rằng đó là lời nói khoa trương? Nhưng chúng ta nên gọi một người đàn ông như thế nào, người đã trở thành người châu Á đầu tiên giành chức vô địch cờ vua thế giới lứa tuổi thiếu niên năm 18 tuổi và người trở thành Đại kiện tướng Ấn Độ đầu tiên năm 19 tuổi? Đó là khởi đầu cho con đường khó khăn đến danh hiệu Vô địch Thế giới của Viswanathan Anand, người đàn ông đã trở thành một phần của lịch sử cờ vua mãi mãi. Giờ đây, một huyền thoại nữa trong nhóm InstaSpot!


Borussia là một trong những câu lạc bộ bóng đá danh giá nhất nước Đức, đã nhiều lần chứng minh cho người hâm mộ thấy: tinh thần thi đấu và sự lãnh đạo chắc chắn sẽ dẫn đến thành công. Giao dịch theo cách mà các chuyên gia thể thao chơi trò chơi: tự tin và chủ động. Giữ một "đường chuyền" từ Borussia FC và dẫn đầu với InstaSpot!
EUR/USD
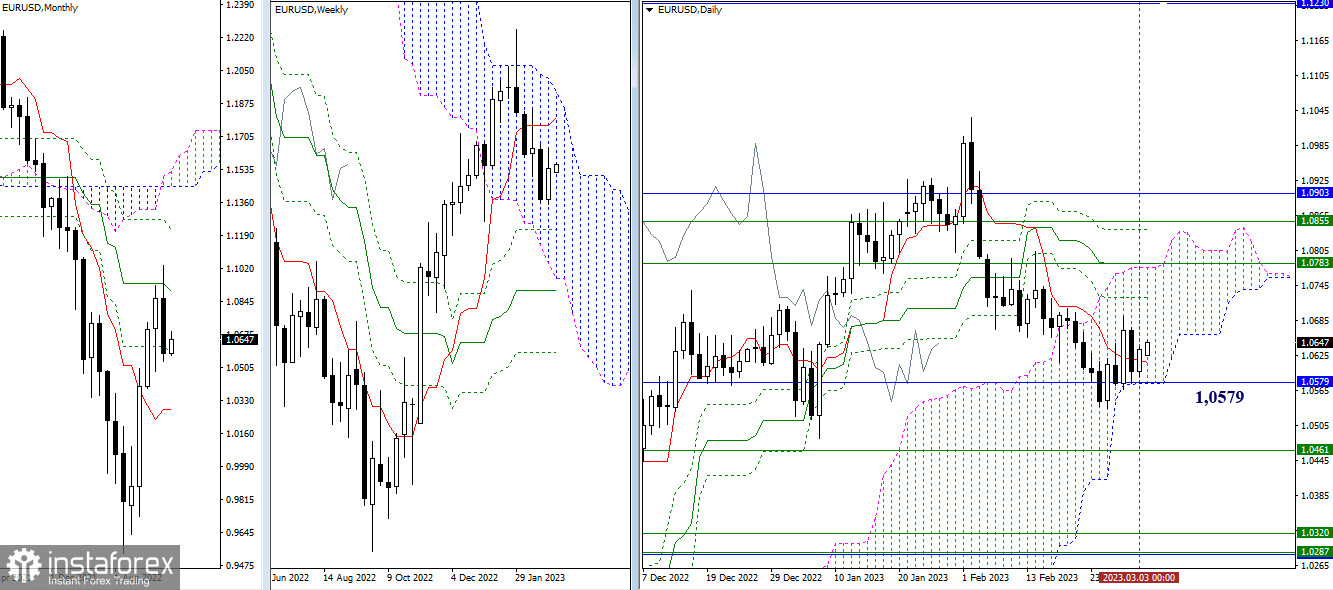
Higher time frames
For the whole past week, the pair was trading near the monthly support level of 1.0579. The bearish sentiment that was prevailing in February did not continue in the first days of March. At the moment, the pair is holding above the monthly support level, and the daily short-term trend level of 1.0612 also confirmed the bullish trend. In case the bullish bias intensifies further, the pair will be trading in a wide range formed by the resistance levels of daily, weekly, and monthly time frames (1.0724 – 1.0783 – 1.0855 – 1.0903). If the price settles above the extremum point of 1.1033 and retests it, it may then head for new upward targets. On the other hand, if the pair leaves the daily Ichimoku Cloud and enters the selling zone by overcoming the monthly support of 1.0579, it may form a new breakout and move towards the weekly Fibo Kijun level of 1.0461 and the area of 1.0284 – 1.0320 (lower line of the weekly cloud + weekly medium-term trend + monthly short-term trend).
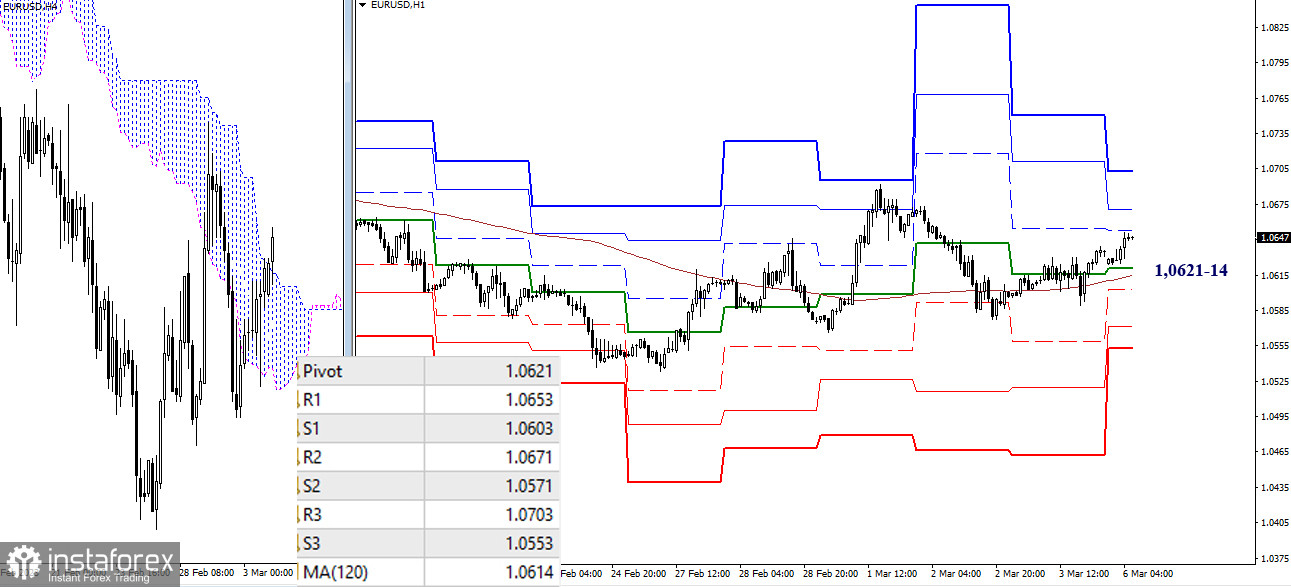
H4 – H1
At the moment of writing, the pair was trading above the key levels on lower time frames. Today, the key levels are found in the narrow range of 1.0621-14 (central daily pivot level + weekly long-term trend). Trading above this area favors the bullish trend. The next upward targets on the intraday chart are seen at 1.0653 – 1.0671 – 1.0703 (standard pivot levels). If bulls lose control of these levels, the market sentiment will change on shorter time frames. If so, traders will focus on the downward targets represented by support levels of 1.0603 – 1.0571 – 1.0553.
***
GBP/USD
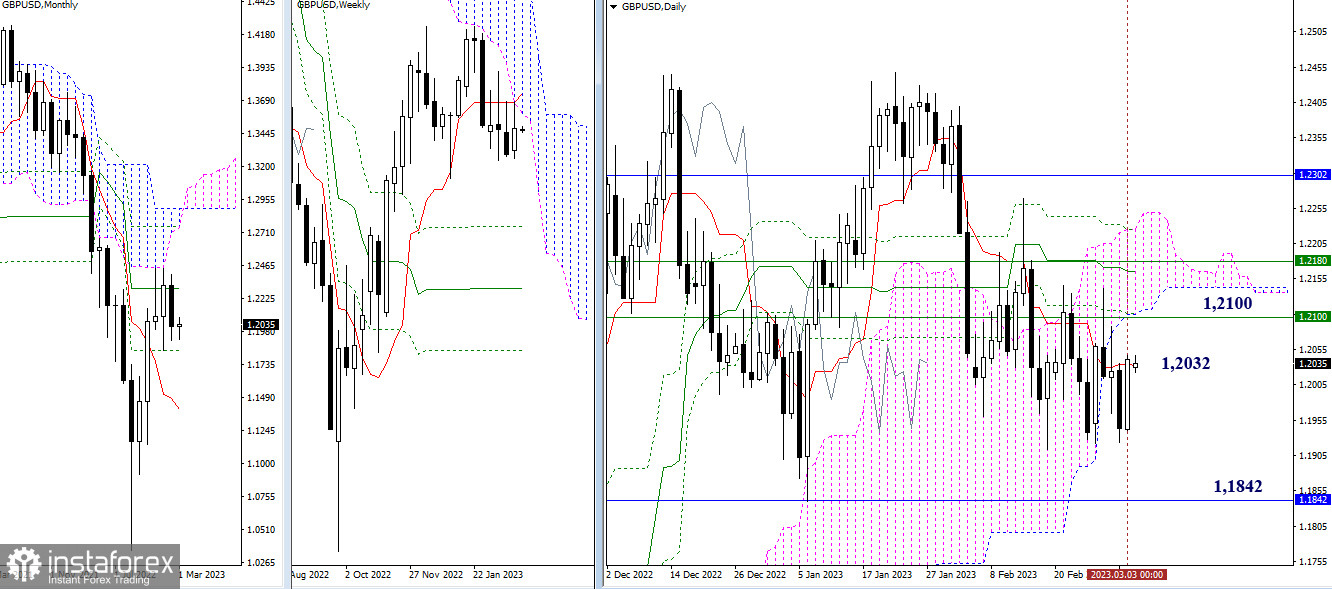
Higher time frames
The pair remained in the consolidation phase in the course of the previous week. The market uncertainty is still high. The daily short-term trend level of 1.2032 remains the key level for today. To change the market situation, the pair should leave the consolidation zone. Bears may see a way to develop a downward movement if the price settles firmly below the monthly support of 1.1842. In the current conditions, buyers will need to break above the resistance levels of different time frames (1,2100 – 1,2180 – 1,2302)to recover and maintain the current trend.
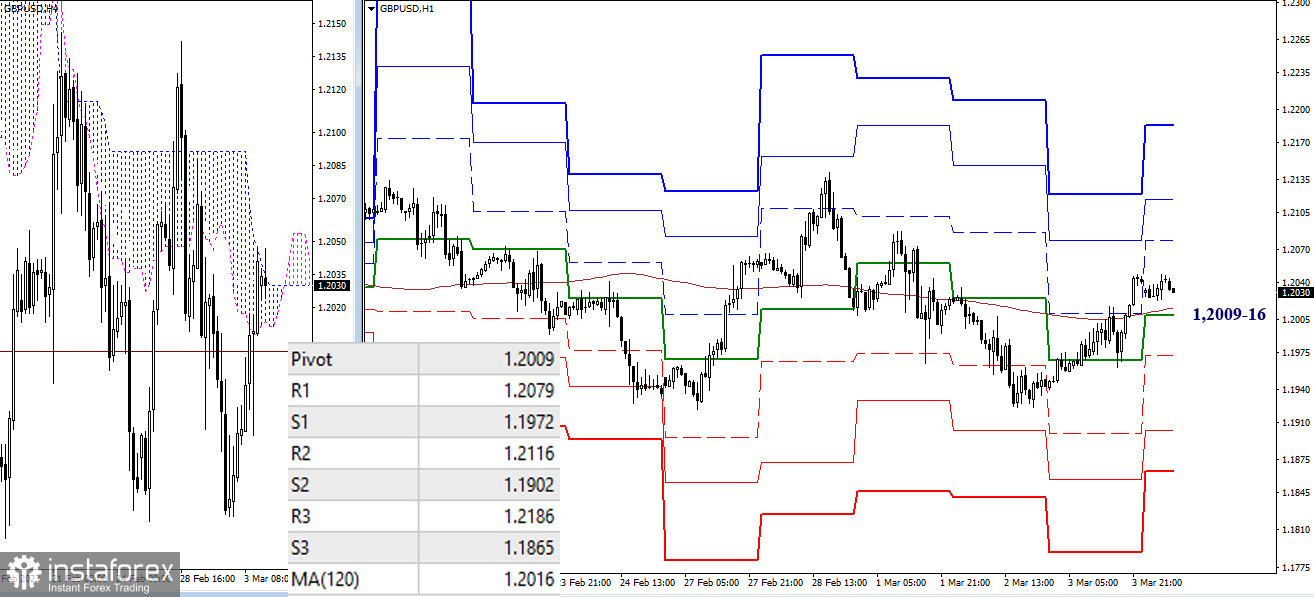
H4 – H1
On lower time frames, the pair has broken above the key levels of 1.2009-16 (central daily pivot level + weekly long-term trend). More intraday upside targets are located in the area of 1.2079 – 1.2116 – 1.2186 formed by the resistance of standard pivot levels. The support area represented by standard pivot levels can be seen at 1.1972 – 1.1902 – 1.1865. The pair may head this way when the market sentiment changes and the price settles firmly below 1.2009-16.
***
Technical analysis is based on:
Higher time frames – Ichimoku Kinko Hyo (9.26.52) + Fibo Kijun levels
Lower time frames – H1: Pivot Points (standard) + 120-day Moving Average (weekly long-term trend)
*Phân tích thị trường được đăng tải ở đây có nghĩa là để gia tăng nhận thức của bạn, nhưng không đưa ra các chỉ dẫn để thực hiện một giao dịch.
InstaSpot analytical reviews will make you fully aware of market trends! Being an InstaSpot client, you are provided with a large number of free services for efficient trading.


