


我们的团队有超过700万的操盘手!
我们每天都在一起努力改善交易。我们得到了很高的成绩,并继续前进。
世界各地数以百万计的操盘手的认可是我们工作的最大赞赏! 您做出了您的选择,我们将尽一切努力来满足您的期望!
我们是一个共同的伟大团队!
InstaSpot. 自豪地为您工作!


The economic calendar was traditionally empty on Monday. No important reports were published in the EU, the United Kingdom, and the Unites States.
Martin Luther King Day was celebrated in the United States. For this reason, banks, funds, and stock exchanges were closed.
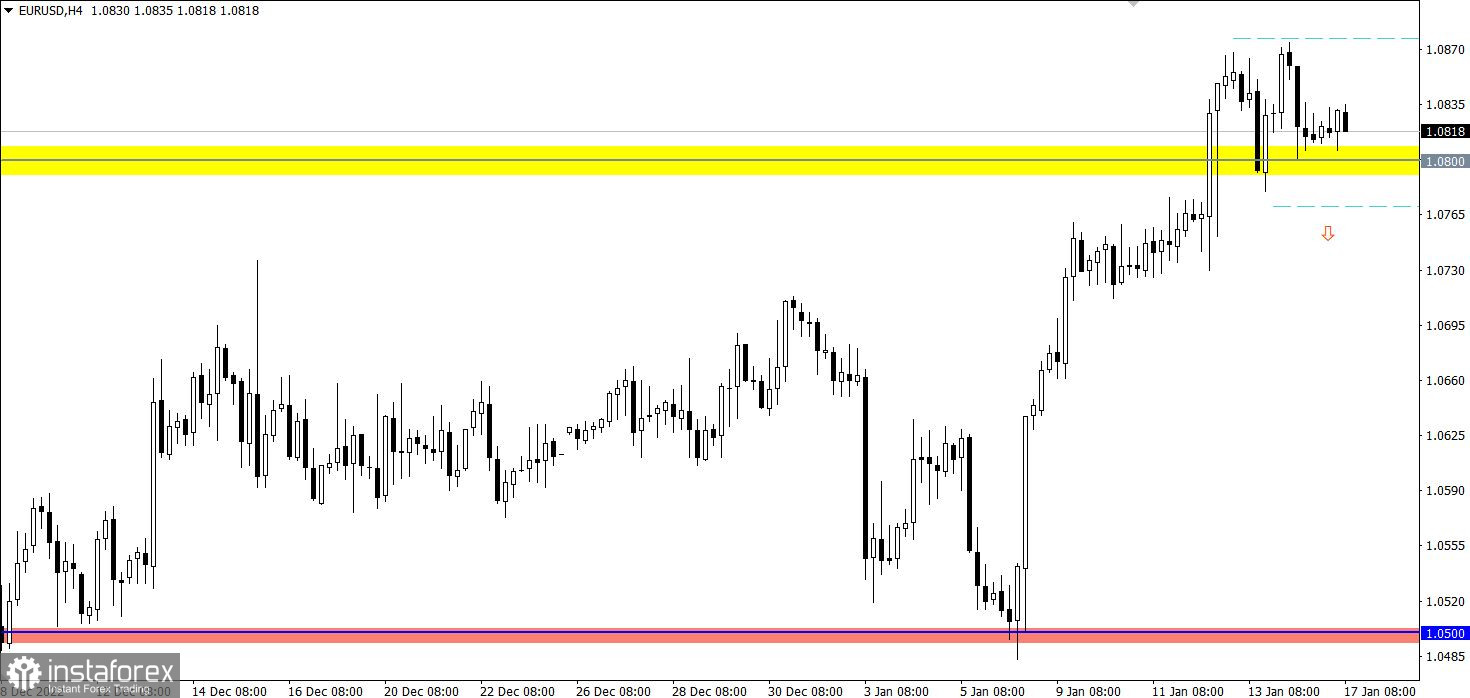
EURUSD reached the 1.0800 level during the pullback stage, where there was an amplitude move within 70 pips. In fact, the market remains in an upward mood, otherwise there would be a full-blown correction.
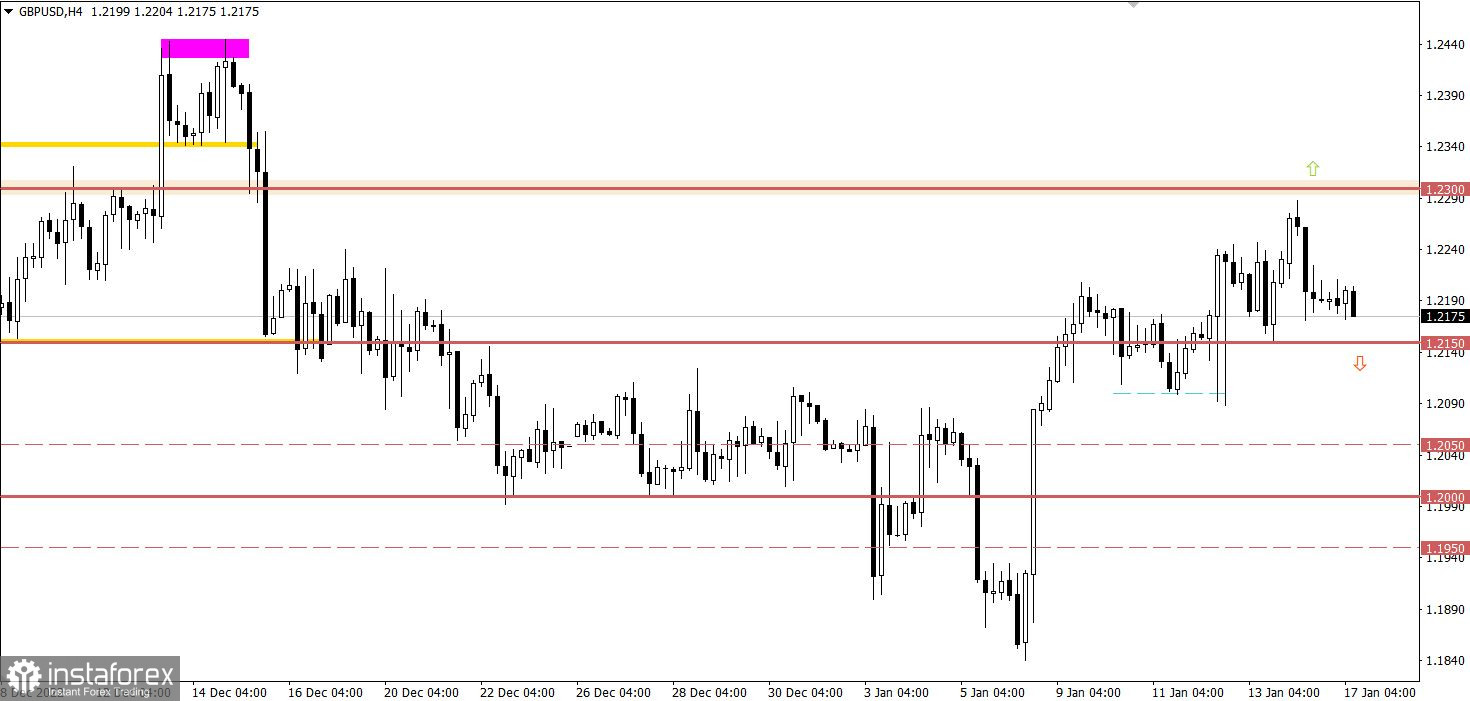
GBPUSD reduced the volume of long positions during the price convergence with the 1.2300 resistance level. As a result, there was a pullback of about 100 pips, which eventually turned into a stagnation.

Since the opening of the European session, data on the UK labor market have been published, which came out without any fundamental changes. Unemployment in the country remained at 3.6%. Employment increased by 27,000, while jobless claims rose by 19,700.
Expectations coincided with the forecast; there is no reaction in the market.
Presumably, the 1.0800/1.0870 amplitude will focus the market on itself only for a while. As a result, the stagnation will end with an impulse emanating from the stagnation, which will indicate one of the possible scenarios.
The first scenario considers the prolongation of the current upward cycle in the market in case of a stable holding of the price above the value of 1.0880 in a four-hour period.
The second scenario considers the transition from a pullback stage to a full correction if the price holds below 1.0770 in a four-hour period.
Stagnation possibly serves as a process of accumulation of trading forces, which can become a lever for new price jumps. The 1.2150 level serves as a variable support, while the resistance is at 1.2300.
In this situation, cardinal changes will occur only after the price stays outside one or another control level for at least a four-hour period.
The candlestick chart type is white and black graphic rectangles with lines above and below. With a detailed analysis of each individual candle, you can see its characteristics relative to a particular time frame: opening price, closing price, intraday high and low.
Horizontal levels are price coordinates, relative to which a price may stop or reverse its trajectory. In the market, these levels are called support and resistance.
Circles and rectangles are highlighted examples where the price reversed in history. This color highlighting indicates horizontal lines that may put pressure on the asset's price in the future.
The up/down arrows are landmarks of the possible price direction in the future.
*这里的市场分析是为了增加您对市场的了解,而不是给出交易的指示。
InstaSpot分析评论将让您充分了解市场趋势! 作为InstaSpot的客户,您将获得大量的免费服务以实现有效的交易。


