


Huyền thoại trong nhóm InstaSpot!
Huyền thoại! Bạn nghĩ rằng đó là lời nói khoa trương? Nhưng chúng ta nên gọi một người đàn ông như thế nào, người đã trở thành người châu Á đầu tiên giành chức vô địch cờ vua thế giới lứa tuổi thiếu niên năm 18 tuổi và người trở thành Đại kiện tướng Ấn Độ đầu tiên năm 19 tuổi? Đó là khởi đầu cho con đường khó khăn đến danh hiệu Vô địch Thế giới của Viswanathan Anand, người đàn ông đã trở thành một phần của lịch sử cờ vua mãi mãi. Giờ đây, một huyền thoại nữa trong nhóm InstaSpot!


Borussia là một trong những câu lạc bộ bóng đá danh giá nhất nước Đức, đã nhiều lần chứng minh cho người hâm mộ thấy: tinh thần thi đấu và sự lãnh đạo chắc chắn sẽ dẫn đến thành công. Giao dịch theo cách mà các chuyên gia thể thao chơi trò chơi: tự tin và chủ động. Giữ một "đường chuyền" từ Borussia FC và dẫn đầu với InstaSpot!
The economic calendar was traditionally empty on Monday. No important reports were published in the EU, the United Kingdom, and the Unites States.
Martin Luther King Day was celebrated in the United States. For this reason, banks, funds, and stock exchanges were closed.
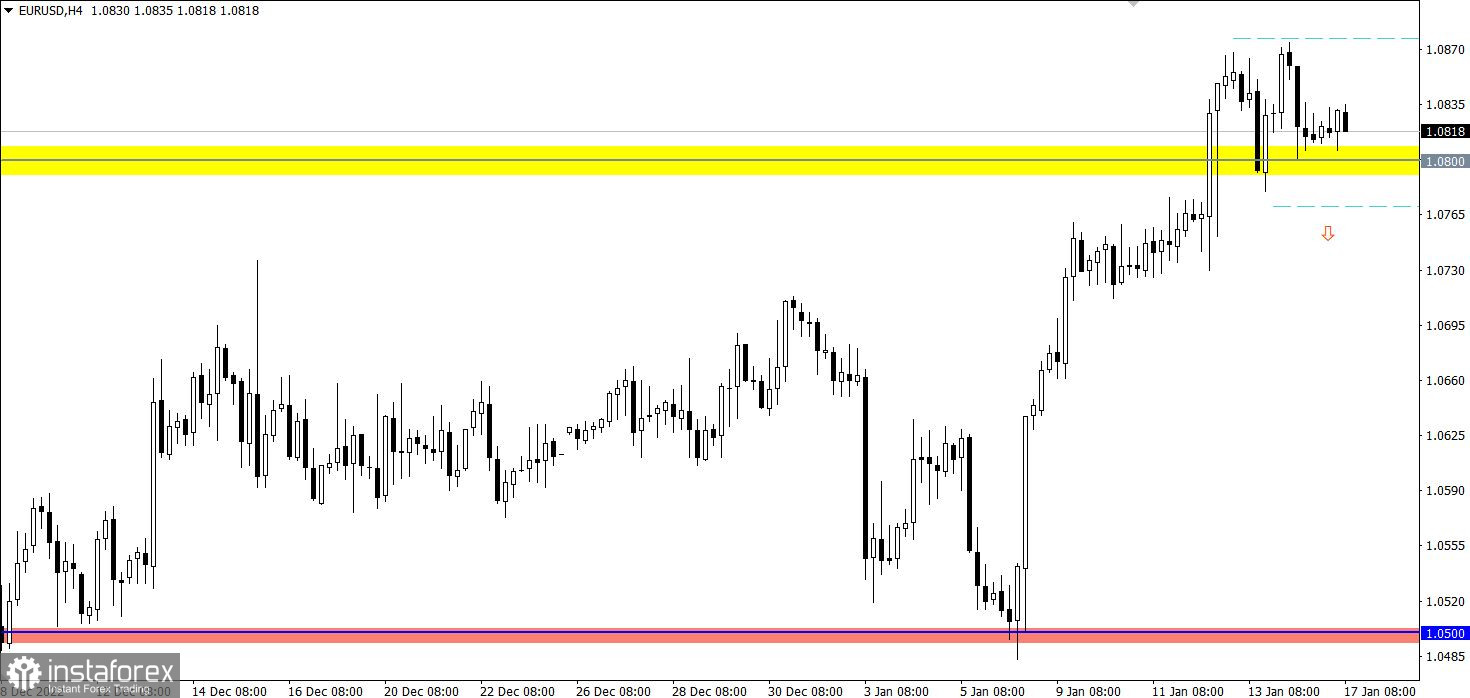
EURUSD reached the 1.0800 level during the pullback stage, where there was an amplitude move within 70 pips. In fact, the market remains in an upward mood, otherwise there would be a full-blown correction.
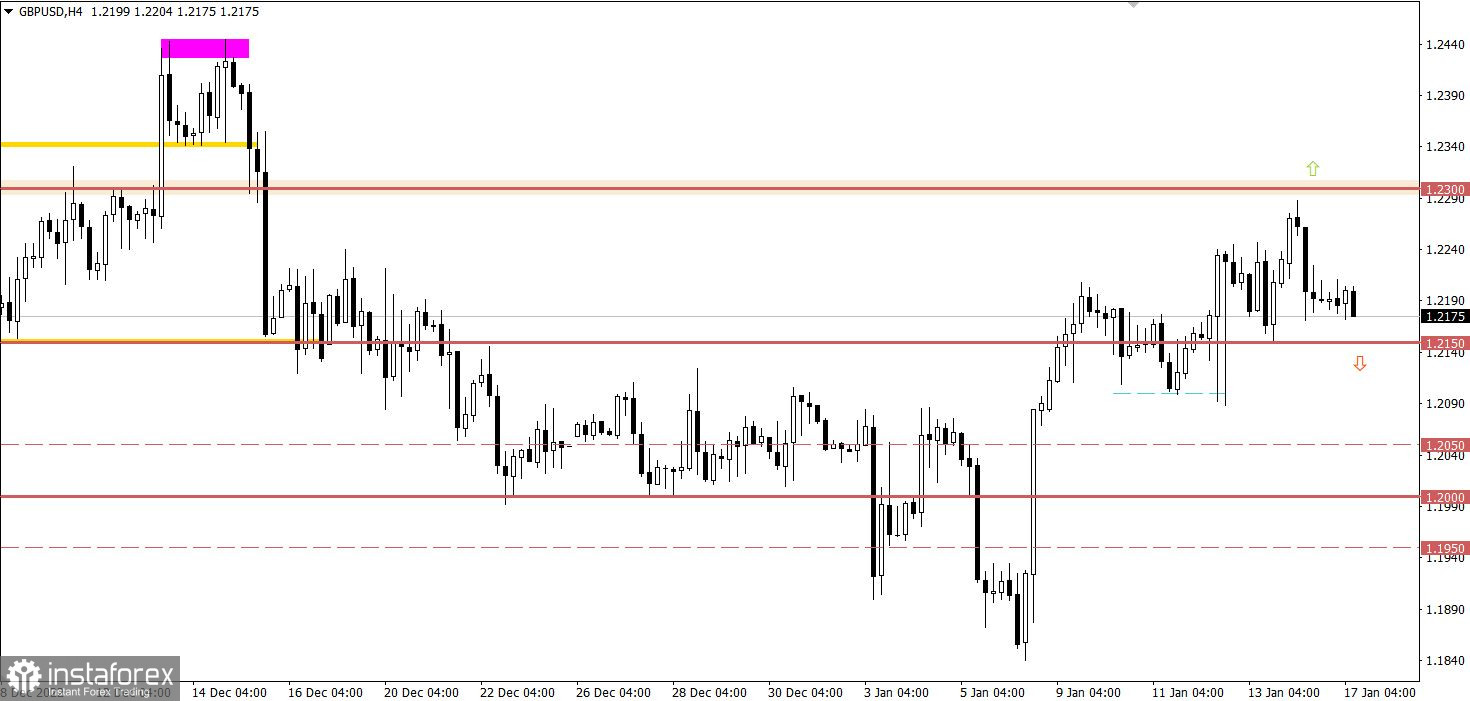
GBPUSD reduced the volume of long positions during the price convergence with the 1.2300 resistance level. As a result, there was a pullback of about 100 pips, which eventually turned into a stagnation.

Since the opening of the European session, data on the UK labor market have been published, which came out without any fundamental changes. Unemployment in the country remained at 3.6%. Employment increased by 27,000, while jobless claims rose by 19,700.
Expectations coincided with the forecast; there is no reaction in the market.
Presumably, the 1.0800/1.0870 amplitude will focus the market on itself only for a while. As a result, the stagnation will end with an impulse emanating from the stagnation, which will indicate one of the possible scenarios.
The first scenario considers the prolongation of the current upward cycle in the market in case of a stable holding of the price above the value of 1.0880 in a four-hour period.
The second scenario considers the transition from a pullback stage to a full correction if the price holds below 1.0770 in a four-hour period.
Stagnation possibly serves as a process of accumulation of trading forces, which can become a lever for new price jumps. The 1.2150 level serves as a variable support, while the resistance is at 1.2300.
In this situation, cardinal changes will occur only after the price stays outside one or another control level for at least a four-hour period.
The candlestick chart type is white and black graphic rectangles with lines above and below. With a detailed analysis of each individual candle, you can see its characteristics relative to a particular time frame: opening price, closing price, intraday high and low.
Horizontal levels are price coordinates, relative to which a price may stop or reverse its trajectory. In the market, these levels are called support and resistance.
Circles and rectangles are highlighted examples where the price reversed in history. This color highlighting indicates horizontal lines that may put pressure on the asset's price in the future.
The up/down arrows are landmarks of the possible price direction in the future.
*Phân tích thị trường được đăng tải ở đây có nghĩa là để gia tăng nhận thức của bạn, nhưng không đưa ra các chỉ dẫn để thực hiện một giao dịch.
InstaSpot analytical reviews will make you fully aware of market trends! Being an InstaSpot client, you are provided with a large number of free services for efficient trading.


