


我们的团队有超过700万的操盘手!
我们每天都在一起努力改善交易。我们得到了很高的成绩,并继续前进。
世界各地数以百万计的操盘手的认可是我们工作的最大赞赏! 您做出了您的选择,我们将尽一切努力来满足您的期望!
我们是一个共同的伟大团队!
InstaSpot. 自豪地为您工作!


Trend analysis
EUR/USD may continue moving upwards this week, starting from the level of 1.0644 (closing of the last weekly candle) to 1.0786, which is the upper fractal (yellow dotted line). A pullback may occur upon reaching the level.
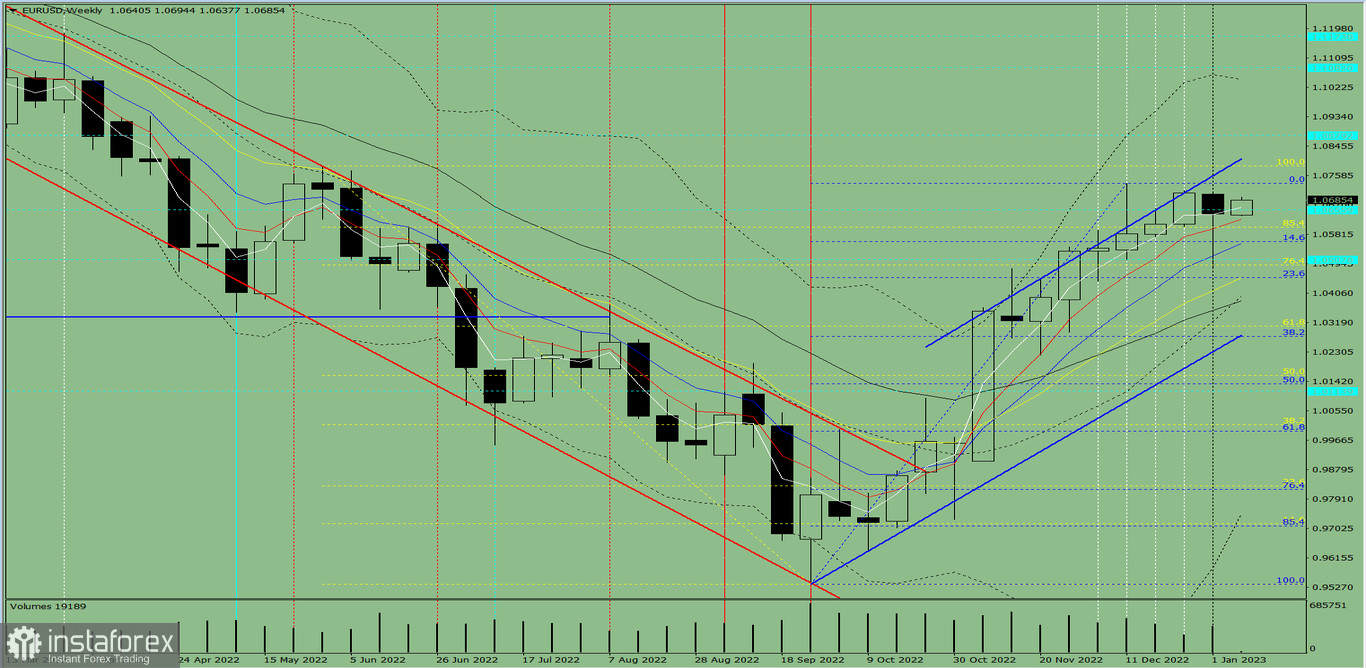
Fig. 1 (weekly chart)
Comprehensive analysis:
Indicator analysis - uptrend
Fibonacci levels - uptrend
Volumes - uptrend
Candlestick analysis - downtrend
Trend analysis - uptrend
Bollinger bands - uptrend
Monthly chart - uptrend
All this points to an upward movement in EUR/USD.
Conclusion: The pair will have a bullish trend, with no first lower shadow on the weekly white candle (Monday - up) and a second upper shadow (Friday - down).
So during the week, euro will rise from 1.0644 (closing of the last weekly candle) to the upper fractal at 1.0786 (yellow dotted line), then have a pullback downwards.
Alternatively, the quote could climb from 1.0644 (closing of the last weekly candle) to the upper fractal at 1.0734 (blue dotted line), then bounce down to the 14.6% retracement level at 1.0560 (blue dotted line). Once this level is reached, the pair will continue its movement upwards.
*这里的市场分析是为了增加您对市场的了解,而不是给出交易的指示。
InstaSpot分析评论将让您充分了解市场趋势! 作为InstaSpot的客户,您将获得大量的免费服务以实现有效的交易。


