


Легендата в екипа на ИнстаФорекс!
Легенда! Мислите ли, че това е бомбастична реторика? Но как да наречем човек, който на 18 години стана първият азиатец спечелил световния шампионат по шах за юноши и на 19 години стана първият гросмайстор на Индия? Това беше началото на труден път към титлата на световен шампион за Вишванатан Ананд, човекът, който стана част от историята на шаха завинаги. Сега още една легенда в екипа на ИнстаФорекс!


Борусия е един от най-титулуваните футболни клубове в Германия, който многократно се е доказал пред феновете: духът на конкуренция и лидерство със сигурност ще доведе до успех. Търгувайте по същия начин, по който спортните професионалисти играят играта: уверено и активно. Запазете „пас" от ФК „Борусия" и бъдете начело с ИнстаФорекс!

Trend analysis
EUR/USD may continue moving upwards this week, starting from the level of 1.0644 (closing of the last weekly candle) to 1.0786, which is the upper fractal (yellow dotted line). A pullback may occur upon reaching the level.
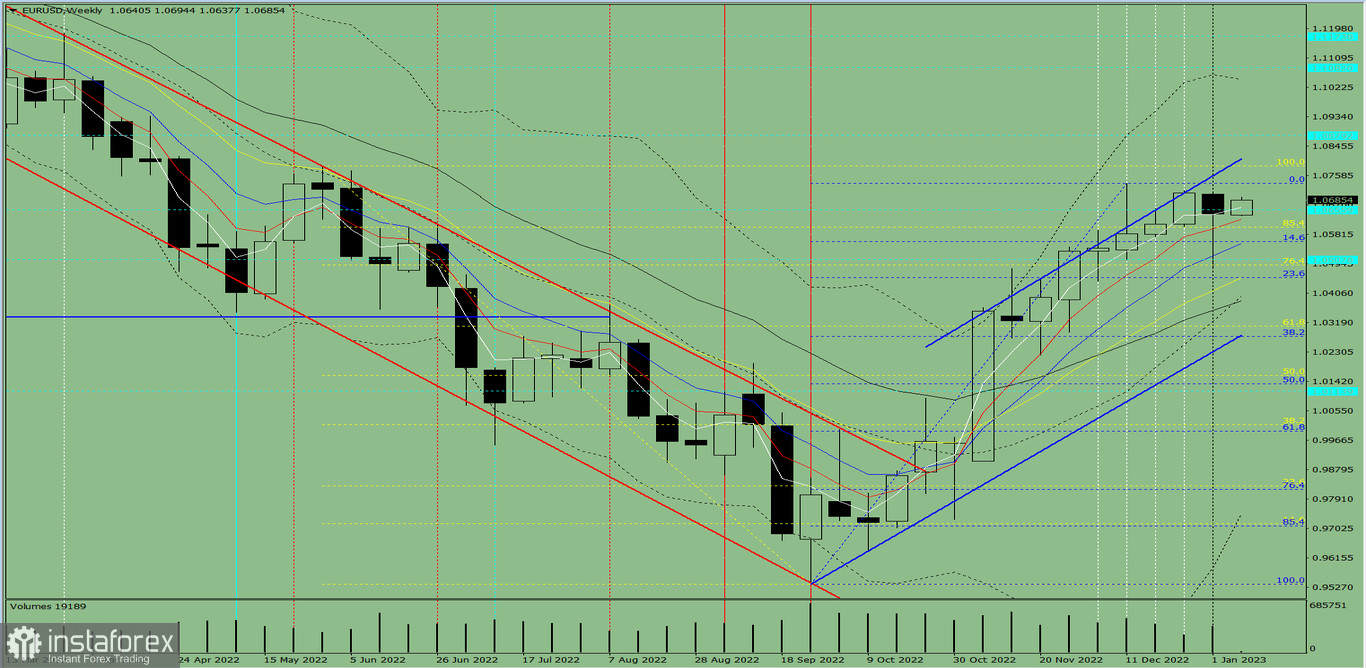
Fig. 1 (weekly chart)
Comprehensive analysis:
Indicator analysis - uptrend
Fibonacci levels - uptrend
Volumes - uptrend
Candlestick analysis - downtrend
Trend analysis - uptrend
Bollinger bands - uptrend
Monthly chart - uptrend
All this points to an upward movement in EUR/USD.
Conclusion: The pair will have a bullish trend, with no first lower shadow on the weekly white candle (Monday - up) and a second upper shadow (Friday - down).
So during the week, euro will rise from 1.0644 (closing of the last weekly candle) to the upper fractal at 1.0786 (yellow dotted line), then have a pullback downwards.
Alternatively, the quote could climb from 1.0644 (closing of the last weekly candle) to the upper fractal at 1.0734 (blue dotted line), then bounce down to the 14.6% retracement level at 1.0560 (blue dotted line). Once this level is reached, the pair will continue its movement upwards.
*Анализът на пазара публикуван тук има за цел да повиши информираността Ви, но не и да дава указания за търговия.
Аналитичните прегледи на ИнстаФорекс ще ви запознаят изцяло с пазарните тенденции! Като клиент на ИнстаФорекс, на вас се предоставят голям брой безплатни услуги за ефикасна търговия.


