


我们的团队有超过700万的操盘手!
我们每天都在一起努力改善交易。我们得到了很高的成绩,并继续前进。
世界各地数以百万计的操盘手的认可是我们工作的最大赞赏! 您做出了您的选择,我们将尽一切努力来满足您的期望!
我们是一个共同的伟大团队!
InstaSpot. 自豪地为您工作!


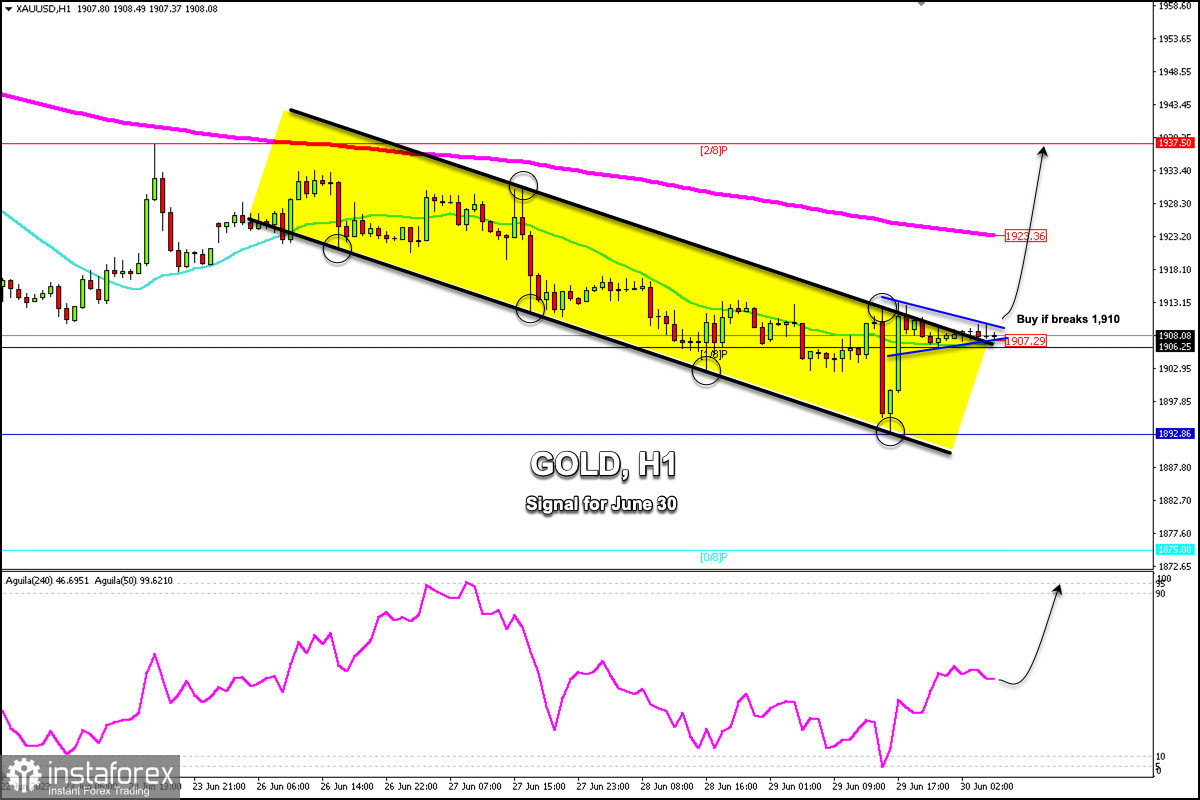
Early in the European session, gold was trading around 1,908.08, above the 21 SMA located at 1,907.29, and above the 1/8 Murray located at 1,906.25.
The 1-hour chart shows that gold has been trading within a downtrend channel since June 23. Yesterday in the American session, the data was favorable for the US dollar, so we saw a strong drop in gold from the top of the downtrend channel towards the bottom of the downtrend channel reaching a new monthly low at around 1,892.95.
In the chart above, we can see a bullish pennant pattern in progress in the last hours. In case there is a sharp break above 1,910, the price could reach the 200 EMA located at 1,923 and finally, it could reach 2/ 8 Murray located at 1,937.
Yesterday, the Eagle indicator reached the extremely oversold zone. Then, we saw a strong technical bounce. So, the metal is likely to continue trending in the next few hours provided that the instrument settles above 1,907. Hence, we could expect it to continue rising until the price reaches the area of 1,937.
In case gold falls and consolidates below 1/8 Murray located at 1,906, we could expect a technical correction and the instrurment could reach the psychological level of 1,900 and finally, could fall towards the 1,892 area.
The daily pivot point is around 1,904.70, suggesting an opportunity for gold to continue higher. If in the next few hours, gold keeps trading above this level, it could reach daily-R1 at 1,916. Finally, it could reach daily-R2 at 1,924. Below this point, if the price falls, we should avoid buying because the bearish trend could resume.
*这里的市场分析是为了增加您对市场的了解,而不是给出交易的指示。
InstaSpot分析评论将让您充分了解市场趋势! 作为InstaSpot的客户,您将获得大量的免费服务以实现有效的交易。


