


Our team has over 7,000,000 traders!
Every day we work together to improve trading. We get high results and move forward.
Recognition by millions of traders all over the world is the best appreciation of our work! You made your choice and we will do everything it takes to meet your expectations!
We are a great team together!
InstaSpot. Proud to work for you!


Actor, UFC 6 tournament champion and a true hero!
The man who made himself. The man that goes our way.
The secret behind Taktarov's success is constant movement towards the goal.
Reveal all the sides of your talent!
Discover, try, fail - but never stop!
InstaSpot. Your success story starts here!

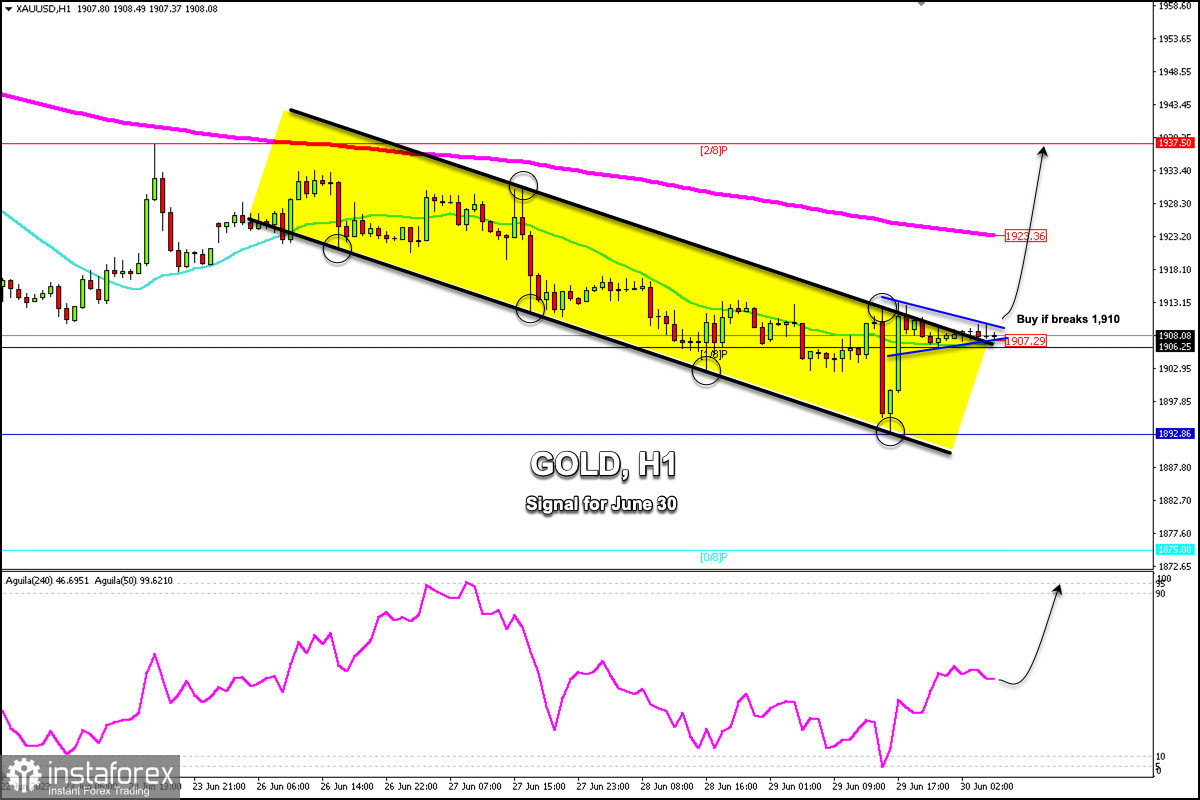
Early in the European session, gold was trading around 1,908.08, above the 21 SMA located at 1,907.29, and above the 1/8 Murray located at 1,906.25.
The 1-hour chart shows that gold has been trading within a downtrend channel since June 23. Yesterday in the American session, the data was favorable for the US dollar, so we saw a strong drop in gold from the top of the downtrend channel towards the bottom of the downtrend channel reaching a new monthly low at around 1,892.95.
In the chart above, we can see a bullish pennant pattern in progress in the last hours. In case there is a sharp break above 1,910, the price could reach the 200 EMA located at 1,923 and finally, it could reach 2/ 8 Murray located at 1,937.
Yesterday, the Eagle indicator reached the extremely oversold zone. Then, we saw a strong technical bounce. So, the metal is likely to continue trending in the next few hours provided that the instrument settles above 1,907. Hence, we could expect it to continue rising until the price reaches the area of 1,937.
In case gold falls and consolidates below 1/8 Murray located at 1,906, we could expect a technical correction and the instrurment could reach the psychological level of 1,900 and finally, could fall towards the 1,892 area.
The daily pivot point is around 1,904.70, suggesting an opportunity for gold to continue higher. If in the next few hours, gold keeps trading above this level, it could reach daily-R1 at 1,916. Finally, it could reach daily-R2 at 1,924. Below this point, if the price falls, we should avoid buying because the bearish trend could resume.
*এখানে পোস্ট করা মার্কেট বিশ্লেষণ আপনার সচেতনতা বৃদ্ধির জন্য প্রদান করা হয়, ট্রেড করার নির্দেশনা প্রদানের জন্য প্রদান করা হয় না।
ইন্সটাফরেক্স বিশ্লেষণমূলক পর্যালোচনাগুলো আপনাকে মার্কেট প্রবণতা সম্পর্কে পুরোপুরি সচেতন করবে! ইন্সটাফরেক্সের একজন গ্রাহক হওয়ায়, দক্ষ ট্রেডিং এর জন্য আপনাকে অনেক সেবা বিনামূল্যে প্রদান করা হয়।


