


The legend in the InstaSpot team!
Legend! You think that's bombastic rhetoric? But how should we call a man, who became the first Asian to win the junior world chess championship at 18 and who became the first Indian Grandmaster at 19? That was the start of a hard path to the World Champion title for Viswanathan Anand, the man who became a part of history of chess forever. Now one more legend in the InstaSpot team!


Borussia is one of the most titled football clubs in Germany, which has repeatedly proved to fans: the spirit of competition and leadership will certainly lead to success. Trade in the same way that sports professionals play the game: confidently and actively. Keep a "pass" from Borussia FC and be in the lead with InstaSpot!
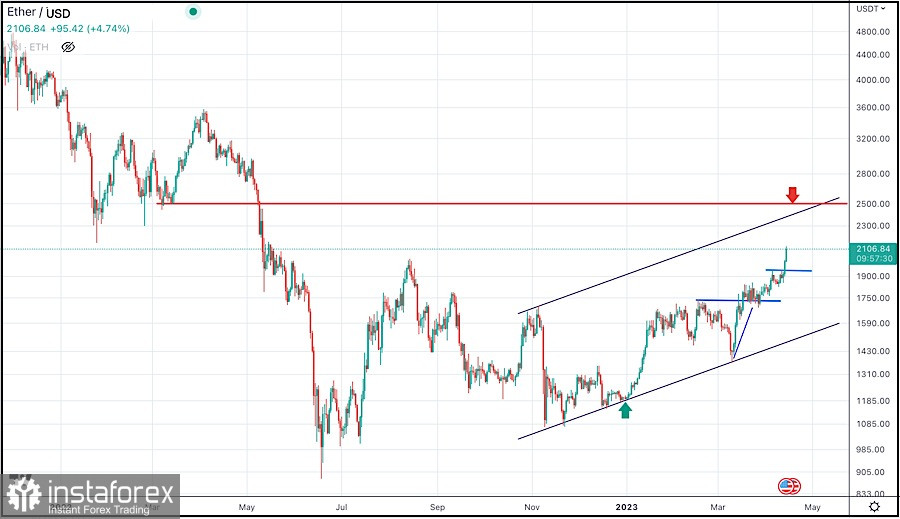
Ethereum has been one of the best-performing cryptocurrencies in the market, with significant gains since the beginning of the year. The recent technical analysis of the Ethereum/USD chart shows a potential bullish trend in the near future.
The updated technical analysis of the Ethereum/USD chart indicates that Ethereum has broken out of a key resistance level against USD, which could lead to further gains.
The cryptocurrency is trading within an ascending channel on the USD chart, signaling a potential bullish move.
Ethereum is trading above its 50-day moving average, indicating a bullish trend. However, the Relative Strength Index (RSI) is approaching overbought levels, which indicates a potential correction.
Hence, Ethereum may experience a pullback before continuing its upward trend against USD.
Traders should keep an eye on the price action around the 2500$ level, as it is a key resistance level. A break above this level could lead to further gains towards the 3000$ level. Conversely, a break below the 2000 $ support level could lead to a short-term bearish trend.
In summary, Ethereum against USD chart points to further continuation of the ongoing bullish trend, with a key resistance level at 2500.
Traders should be cautious and wait for confirmation of the bullish trend before entering any long positions.
*这里的市场分析是为了增加您对市场的了解,而不是给出交易的指示。
InstaSpot分析评论将让您充分了解市场趋势! 作为InstaSpot的客户,您将获得大量的免费服务以实现有效的交易。


