


ทีมงานของพวกเรา พร้อมกับเทรดเดอร์มากกว่า 7,000,000 คน!
ในทุกวัน พวกเราได้รวมงานร่วมกันเพื่อพัฒนาการเทรด พวกเรามีผลตอบรับที่ดี และยังเดินหน้าต่อไป
การยอมรับจากเทรดเดอร์นับล้านจากทั่วทุกมุมโลกนั้นเป็น ผลงา่นอันน่าประทับใจมากที่สุดของพวกเรา! คุณเลือกตัวเลือก และพวกเราจะจัดการทุกอย่างให้ตรงกับการคาดหวังของคุณ !
พวกเราเป็นทีมงานที่ดีที่สุด!
InstaSpot รู้สึกเป็นเกียรติที่ได้ร่วมงานกับคุณ !


นักแสดง, แชมป์เปี้ยนทัวร์นาเม้น UFC 6 และฮิโรที่แท้จริง !
ชายผู้สามารถก่อร่างสร้างตัวขึ้นมาได้ด้วยตัวเขาเอง ชายผู้ที่นำพาเส้นทางให้พวกเรา
ความลับที่อยู่เบื้องหลังความสำเร็จของ Taktarov ก็คือการมุ่งหน้าไปสู่เป้าหมายแบบทันที
เปิดเผยทุกด้านของความสำเร็จคุณ !
ค้นพบ, พยายาม, ผิดพลาดได้ แต่อย่าพึ่งหยุดยั่ง !
InstaSpot ที่พร้อมจะเป็นจุดเริ่มต้น เรื่องราวความสำเร็จของคุณ !

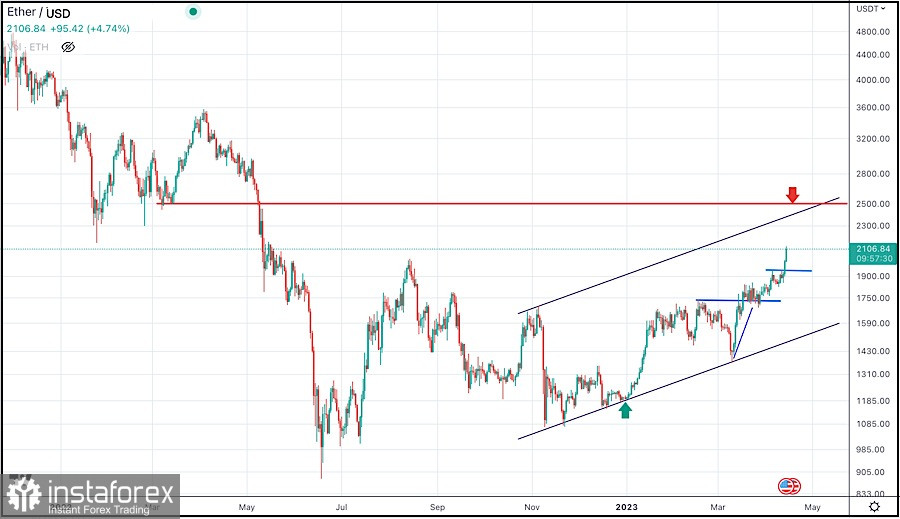
Ethereum has been one of the best-performing cryptocurrencies in the market, with significant gains since the beginning of the year. The recent technical analysis of the Ethereum/USD chart shows a potential bullish trend in the near future.
The updated technical analysis of the Ethereum/USD chart indicates that Ethereum has broken out of a key resistance level against USD, which could lead to further gains.
The cryptocurrency is trading within an ascending channel on the USD chart, signaling a potential bullish move.
Ethereum is trading above its 50-day moving average, indicating a bullish trend. However, the Relative Strength Index (RSI) is approaching overbought levels, which indicates a potential correction.
Hence, Ethereum may experience a pullback before continuing its upward trend against USD.
Traders should keep an eye on the price action around the 2500$ level, as it is a key resistance level. A break above this level could lead to further gains towards the 3000$ level. Conversely, a break below the 2000 $ support level could lead to a short-term bearish trend.
In summary, Ethereum against USD chart points to further continuation of the ongoing bullish trend, with a key resistance level at 2500.
Traders should be cautious and wait for confirmation of the bullish trend before entering any long positions.
*บทวิเคราะห์ในตลาดที่มีการโพสต์ตรงนี้ เพียงเพื่อทำให้คุณทราบถึงข้อมูล ไม่ได้เป็นการเจาะจงถึงขั้นตอนให้คุณทำการซื้อขายตาม
บทวิเคราะห์ของทาง InstaSpot จะทำให้คุณทราบถึงแนวโน้มของตลาด! ในการที่เป็นลูกค้าของทาง InstaSpot นั้นคุณจะได้รับการบริการเพื่อการซื้อขายอย่างเต็มประสิทธิภาพอย่างมากมาย


