


The legend in the InstaSpot team!
Legend! You think that's bombastic rhetoric? But how should we call a man, who became the first Asian to win the junior world chess championship at 18 and who became the first Indian Grandmaster at 19? That was the start of a hard path to the World Champion title for Viswanathan Anand, the man who became a part of history of chess forever. Now one more legend in the InstaSpot team!


Borussia is one of the most titled football clubs in Germany, which has repeatedly proved to fans: the spirit of competition and leadership will certainly lead to success. Trade in the same way that sports professionals play the game: confidently and actively. Keep a "pass" from Borussia FC and be in the lead with InstaSpot!
Overview :
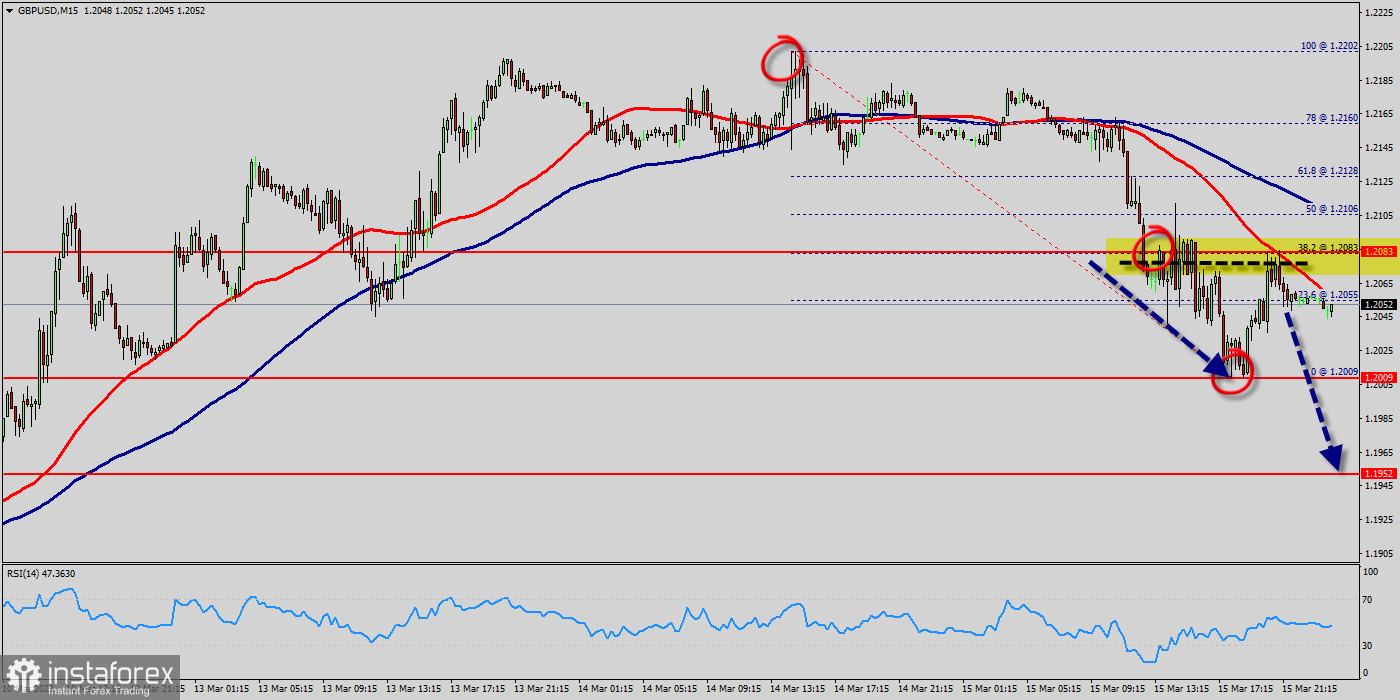
Yesterday, the GBP/USD pair dropped sharply from the level of 1.2083 towards 1.2009. Now, the price is set at 1.2056. On the M15 chart, the resistance of GBP/USD pair is seen at the level of 1.2083 and 1.2106.
It should be noted that volatility is very high for that the GBP/USD pair is still moving between 1.2083 and 1.2009 in coming hours.
Also, it should be noticed that resistance 1 is seen at the level of 1.2083 which coincides the daily pivot point.
So, we expect the price to set below the strong resistance at the levels of 1.2083; because the price is in a bearish channel now. The RSI starts signaling a downward trend. Consequently, the market is likely to show signs of a bearish trend.
Moreover, the price spot of 1.2083 remains a significant resistance zone. Therefore, there is a possibility that the GBP/USD pair will move downside and the structure of a fall does not look corrective. It will indicate the bearish opportunity below 1.2083, sell below 1.2083 with the first target at 1.2009 in order to test yesterday's bottom.
Additionally, if the GBP/USD pair is able to break out the bottom at 1.2009, the market will decline further to 1.1952 in order to test the weekly support 2.
However, it would also be sage to consider where to place a stop loss; this should be set above the second resistance of 1.2128.
*这里的市场分析是为了增加您对市场的了解,而不是给出交易的指示。
InstaSpot分析评论将让您充分了解市场趋势! 作为InstaSpot的客户,您将获得大量的免费服务以实现有效的交易。


