


الأسطورة فى فريق إنستافوركس!
الأسطورة! هل تعتقد أن هذا هو الخطاب المنمق؟ ولكن كيف ينبغي أن نطلق على الرجل، الذي أصبح أول آسيوي يفوز ببطولة العالم للشطرنج للشباب بعمر 18 سنة والذي أصبح أول أستاذ كبير هندي في سن 19؟ وكانت هذه بداية طريق صعب إلى لقب بطل العالم لـ فيسواناثان أناند، الرجل الذي أصبح جزءًا من تاريخ الشطرنج إلى الأبد. والآن أسطورة آخر في فريق إنستافوركس!


يعتبر بوروسيا دورتموند أحد أكثر أندية كرة القدم حصولاً على الألقاب في ألمانيا، وقد أثبت ذلك مرارًا وتكرارًا للجماهير: فإنّ روح المنافسة والقيادة ستؤدي بالتأكيد إلى النجاح. قم بالتداول بنفس الطريقة التي يلعب بها المحترفون الرياضيون اللعبة: بثقة ونشاط. احتفظ بـ "ترخيص دخول" من نادي بوروسيا دورتموند لكرة القدم وكن في الصدارة مع إنستافوركس!
Overview :
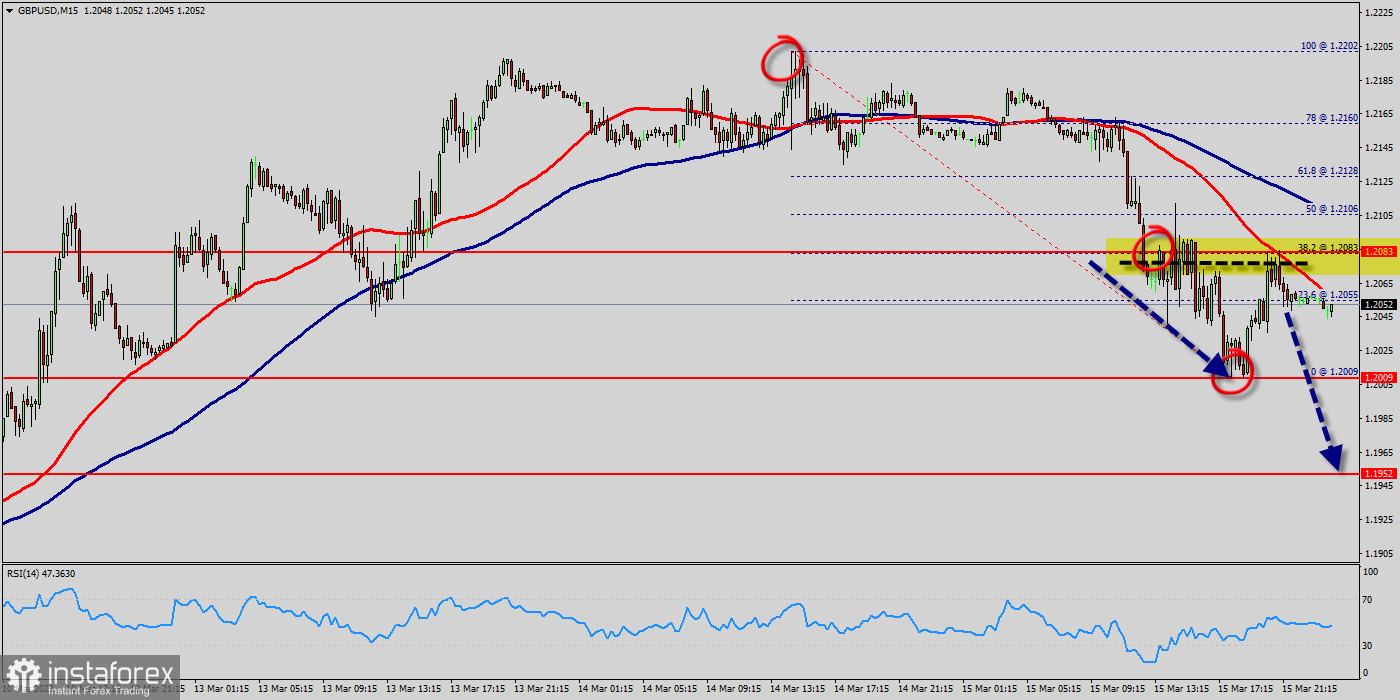
Yesterday, the GBP/USD pair dropped sharply from the level of 1.2083 towards 1.2009. Now, the price is set at 1.2056. On the M15 chart, the resistance of GBP/USD pair is seen at the level of 1.2083 and 1.2106.
It should be noted that volatility is very high for that the GBP/USD pair is still moving between 1.2083 and 1.2009 in coming hours.
Also, it should be noticed that resistance 1 is seen at the level of 1.2083 which coincides the daily pivot point.
So, we expect the price to set below the strong resistance at the levels of 1.2083; because the price is in a bearish channel now. The RSI starts signaling a downward trend. Consequently, the market is likely to show signs of a bearish trend.
Moreover, the price spot of 1.2083 remains a significant resistance zone. Therefore, there is a possibility that the GBP/USD pair will move downside and the structure of a fall does not look corrective. It will indicate the bearish opportunity below 1.2083, sell below 1.2083 with the first target at 1.2009 in order to test yesterday's bottom.
Additionally, if the GBP/USD pair is able to break out the bottom at 1.2009, the market will decline further to 1.1952 in order to test the weekly support 2.
However, it would also be sage to consider where to place a stop loss; this should be set above the second resistance of 1.2128.
*The market analysis posted here is meant to increase your awareness, but not to give instructions to make a trade.
InstaSpot analytical reviews will make you fully aware of market trends! Being an InstaSpot client, you are provided with a large number of free services for efficient trading.


