


我们的团队有超过700万的操盘手!
我们每天都在一起努力改善交易。我们得到了很高的成绩,并继续前进。
世界各地数以百万计的操盘手的认可是我们工作的最大赞赏! 您做出了您的选择,我们将尽一切努力来满足您的期望!
我们是一个共同的伟大团队!
InstaSpot. 自豪地为您工作!


Retail sales in the UK show a slowdown in growth rates from 9.1% to 7.0%.
It is worth considering that the data was published for February, and given the current situation, they are no longer considered informative, since the March figures may turn out to be more deplorable.
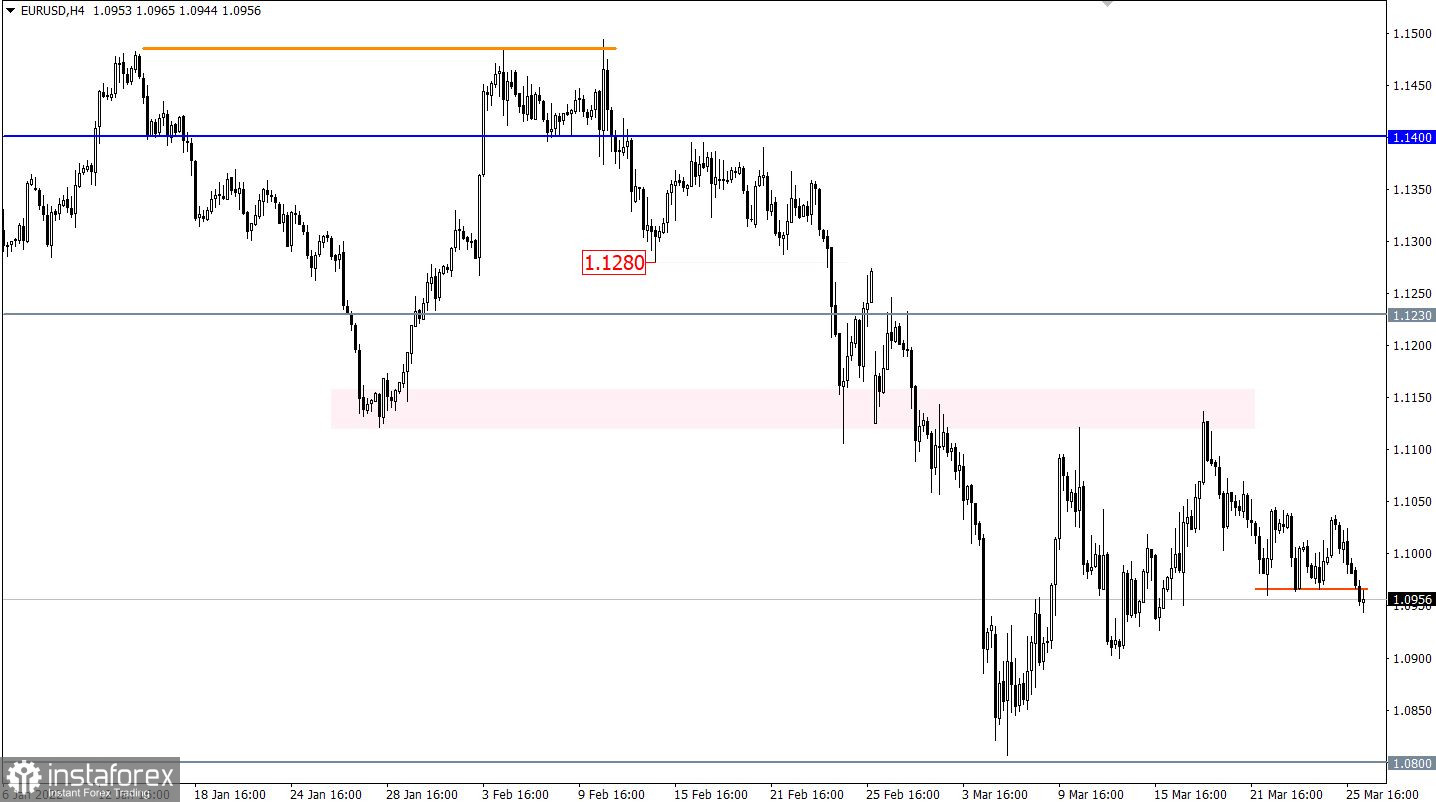
The EURUSD currency pair, after several days of stagnation in the range of 1.0960/1.1050, managed to overcome its lower limit. This led to an increase in the volume of short positions and a restart of the price recovery process relative to a three-week correction.
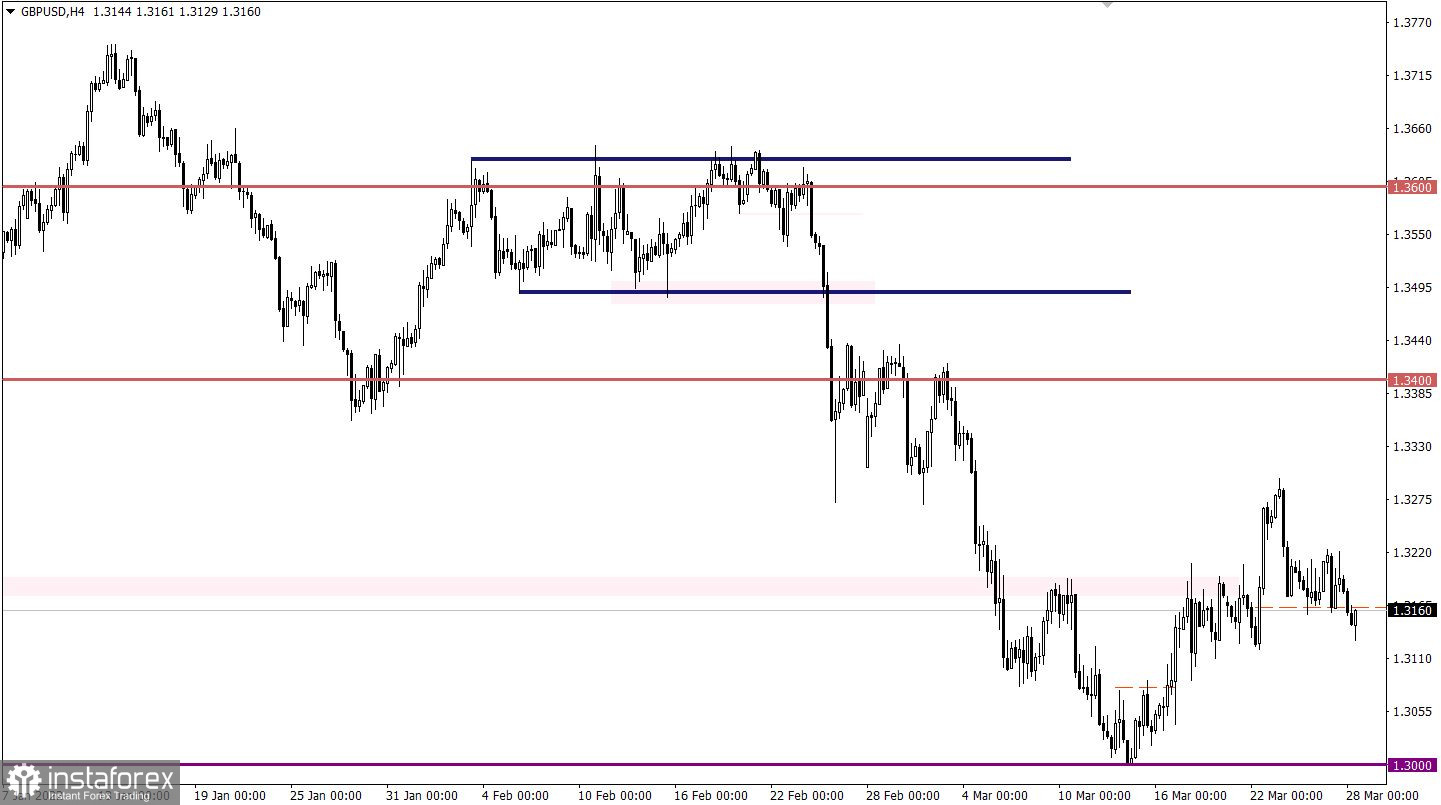
The variable pivot point 1.3175 for the GBPUSD pair was passed by the sellers. This led to an increase in the volume of short positions and keeping the price below 1.3150. As a result of these steps, there was a signal of restoration of dollar positions relative to the recent correction.

Monday is traditionally accompanied by an empty macroeconomic calendar. Nevertheless, stable information and news flow will continue to play on the nerves of speculators, which allows for new jumps in the market.
In this situation, holding the price stable below 1.0960 in a four-hour period will lead to a phased recovery process. As a guide, market participants consider the values of 1.0900-1.0800.
An alternative market development scenario will be considered by traders if the price returns above 1.1000. In this case, the flat may resume.
Based on a number of technical signals, we can say that the market is dominated by a downward trend. This could lead to further weakening of the pound towards the main level of 1.3000.
A candlestick chart view is graphical rectangles of white and black light, with sticks on top and bottom. When analyzing each candle in detail, you will see its characteristics of a relative period: the opening price, closing price, and maximum and minimum prices.
Horizontal levels are price coordinates, relative to which a stop or a price reversal may occur. These levels are called support and resistance in the market.
Circles and rectangles are highlighted examples where the price of the story unfolded. This color selection indicates horizontal lines that may put pressure on the quote in the future.
The up/down arrows are the reference points of the possible price direction in the future.
*这里的市场分析是为了增加您对市场的了解,而不是给出交易的指示。
InstaSpot分析评论将让您充分了解市场趋势! 作为InstaSpot的客户,您将获得大量的免费服务以实现有效的交易。


