


ทีมงานของพวกเรา พร้อมกับเทรดเดอร์มากกว่า 7,000,000 คน!
ในทุกวัน พวกเราได้รวมงานร่วมกันเพื่อพัฒนาการเทรด พวกเรามีผลตอบรับที่ดี และยังเดินหน้าต่อไป
การยอมรับจากเทรดเดอร์นับล้านจากทั่วทุกมุมโลกนั้นเป็น ผลงา่นอันน่าประทับใจมากที่สุดของพวกเรา! คุณเลือกตัวเลือก และพวกเราจะจัดการทุกอย่างให้ตรงกับการคาดหวังของคุณ !
พวกเราเป็นทีมงานที่ดีที่สุด!
InstaSpot รู้สึกเป็นเกียรติที่ได้ร่วมงานกับคุณ !


นักแสดง, แชมป์เปี้ยนทัวร์นาเม้น UFC 6 และฮิโรที่แท้จริง !
ชายผู้สามารถก่อร่างสร้างตัวขึ้นมาได้ด้วยตัวเขาเอง ชายผู้ที่นำพาเส้นทางให้พวกเรา
ความลับที่อยู่เบื้องหลังความสำเร็จของ Taktarov ก็คือการมุ่งหน้าไปสู่เป้าหมายแบบทันที
เปิดเผยทุกด้านของความสำเร็จคุณ !
ค้นพบ, พยายาม, ผิดพลาดได้ แต่อย่าพึ่งหยุดยั่ง !
InstaSpot ที่พร้อมจะเป็นจุดเริ่มต้น เรื่องราวความสำเร็จของคุณ !

Retail sales in the UK show a slowdown in growth rates from 9.1% to 7.0%.
It is worth considering that the data was published for February, and given the current situation, they are no longer considered informative, since the March figures may turn out to be more deplorable.
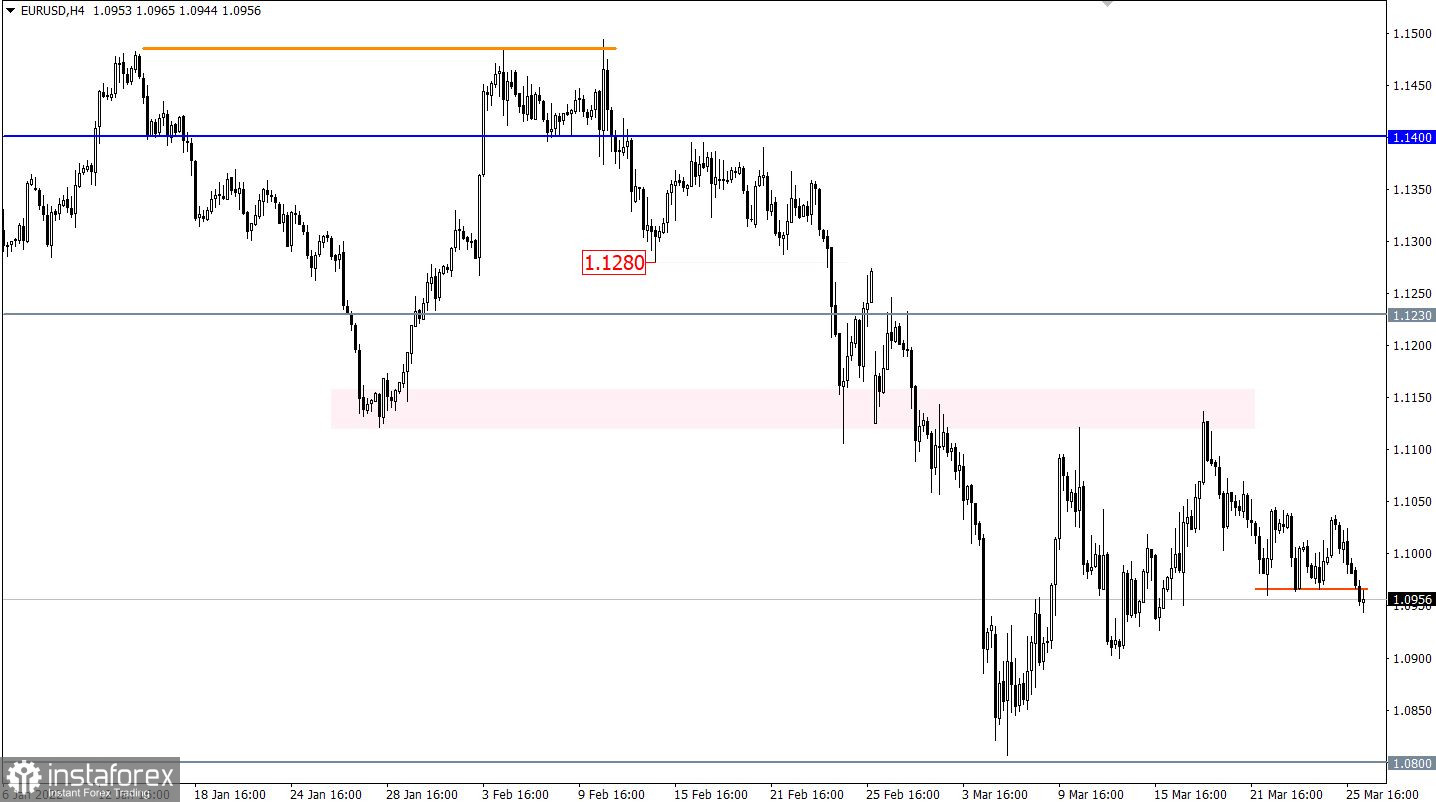
The EURUSD currency pair, after several days of stagnation in the range of 1.0960/1.1050, managed to overcome its lower limit. This led to an increase in the volume of short positions and a restart of the price recovery process relative to a three-week correction.
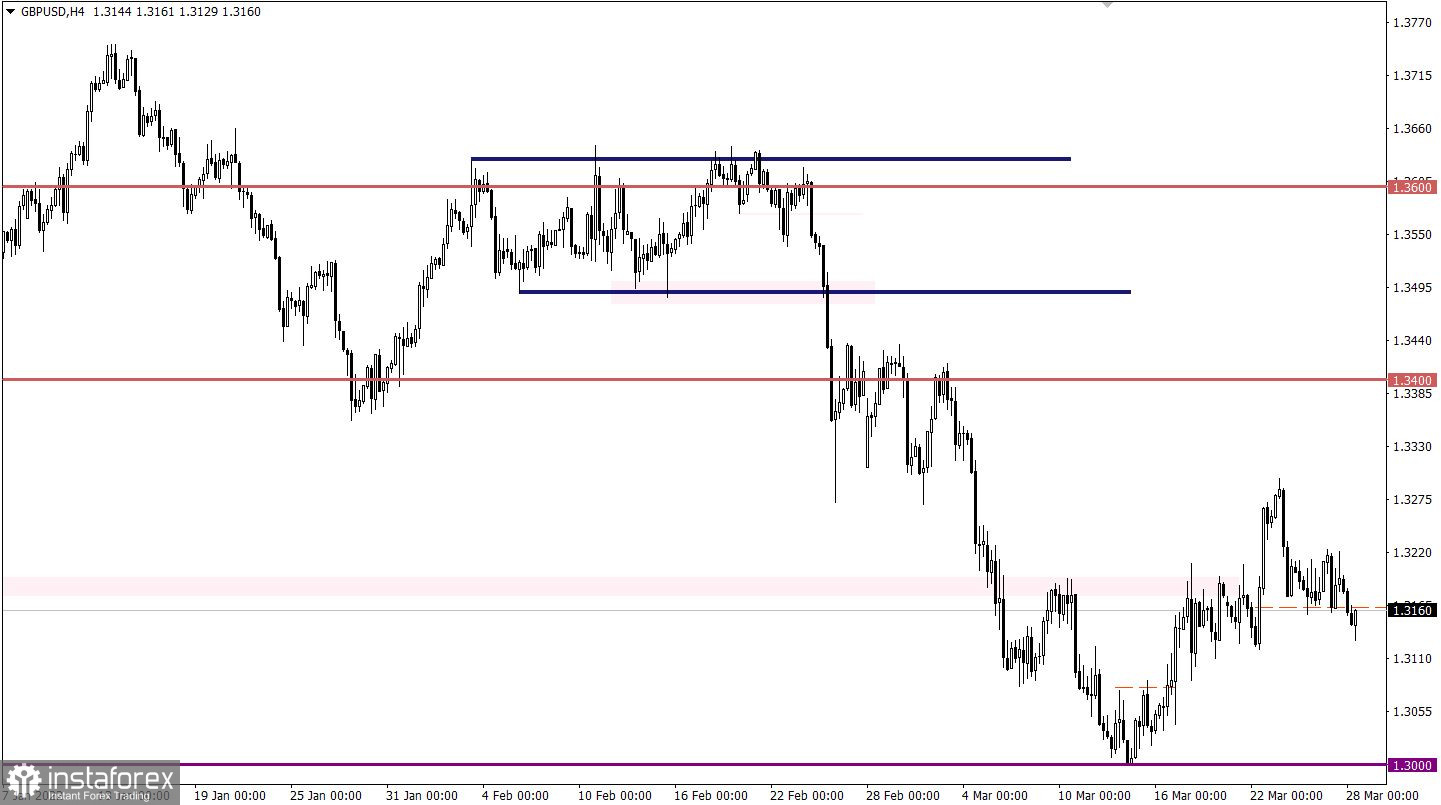
The variable pivot point 1.3175 for the GBPUSD pair was passed by the sellers. This led to an increase in the volume of short positions and keeping the price below 1.3150. As a result of these steps, there was a signal of restoration of dollar positions relative to the recent correction.

Monday is traditionally accompanied by an empty macroeconomic calendar. Nevertheless, stable information and news flow will continue to play on the nerves of speculators, which allows for new jumps in the market.
In this situation, holding the price stable below 1.0960 in a four-hour period will lead to a phased recovery process. As a guide, market participants consider the values of 1.0900-1.0800.
An alternative market development scenario will be considered by traders if the price returns above 1.1000. In this case, the flat may resume.
Based on a number of technical signals, we can say that the market is dominated by a downward trend. This could lead to further weakening of the pound towards the main level of 1.3000.
A candlestick chart view is graphical rectangles of white and black light, with sticks on top and bottom. When analyzing each candle in detail, you will see its characteristics of a relative period: the opening price, closing price, and maximum and minimum prices.
Horizontal levels are price coordinates, relative to which a stop or a price reversal may occur. These levels are called support and resistance in the market.
Circles and rectangles are highlighted examples where the price of the story unfolded. This color selection indicates horizontal lines that may put pressure on the quote in the future.
The up/down arrows are the reference points of the possible price direction in the future.
*บทวิเคราะห์ในตลาดที่มีการโพสต์ตรงนี้ เพียงเพื่อทำให้คุณทราบถึงข้อมูล ไม่ได้เป็นการเจาะจงถึงขั้นตอนให้คุณทำการซื้อขายตาม
บทวิเคราะห์ของทาง InstaSpot จะทำให้คุณทราบถึงแนวโน้มของตลาด! ในการที่เป็นลูกค้าของทาง InstaSpot นั้นคุณจะได้รับการบริการเพื่อการซื้อขายอย่างเต็มประสิทธิภาพอย่างมากมาย


