


我们的团队有超过700万的操盘手!
我们每天都在一起努力改善交易。我们得到了很高的成绩,并继续前进。
世界各地数以百万计的操盘手的认可是我们工作的最大赞赏! 您做出了您的选择,我们将尽一切努力来满足您的期望!
我们是一个共同的伟大团队!
InstaSpot. 自豪地为您工作!


Bitcoin dropped below $18,200 over the last week before finding support and bouncing back to $19,500, producing a bullish candlestick pattern on the daily chart. The crypto seems to have carved a higher low around the $18,600 level and is now preparing to push higher towards at least $22,900. Bulls are looking to be back in control by holding above the $18,200 mark.
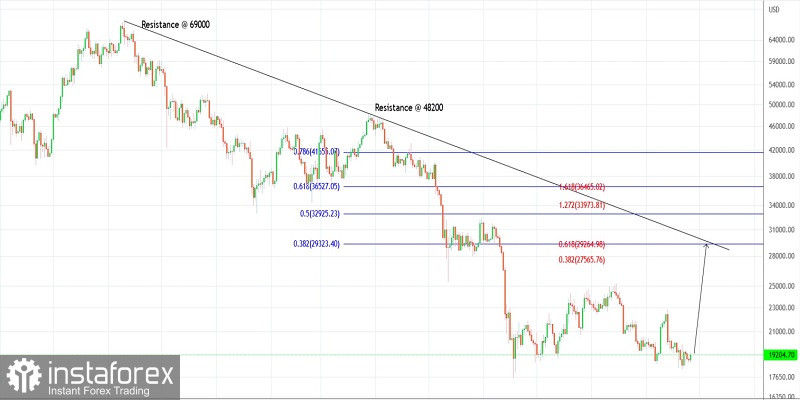
Bitcoin has carved a larger degree bearish boundary between $69,000 and $17,500 as can be seen on the daily chart presented here. The recent downswing being worked upon is between $48,200 and $17,500. A potential target is seen towards the $29,500 level, which is also the 0.382 Fibonacci retracement of the above downswing. Strong resistance is expected to be seen there.
There is also the Fibonacci convergence seen around $29,500 which increases the probability of a strong bearish reversal. Alternatively, if the price continues to slide from there, it could break below $17,500 and slide further towards at least $15,000. As long as the $17,500 support stays intact, prices are likely to move higher.
Potential rally towards $29,500 against $17,500
Good luck!
*这里的市场分析是为了增加您对市场的了解,而不是给出交易的指示。
InstaSpot分析评论将让您充分了解市场趋势! 作为InstaSpot的客户,您将获得大量的免费服务以实现有效的交易。


