


الأسطورة فى فريق إنستافوركس!
الأسطورة! هل تعتقد أن هذا هو الخطاب المنمق؟ ولكن كيف ينبغي أن نطلق على الرجل، الذي أصبح أول آسيوي يفوز ببطولة العالم للشطرنج للشباب بعمر 18 سنة والذي أصبح أول أستاذ كبير هندي في سن 19؟ وكانت هذه بداية طريق صعب إلى لقب بطل العالم لـ فيسواناثان أناند، الرجل الذي أصبح جزءًا من تاريخ الشطرنج إلى الأبد. والآن أسطورة آخر في فريق إنستافوركس!


يعتبر بوروسيا دورتموند أحد أكثر أندية كرة القدم حصولاً على الألقاب في ألمانيا، وقد أثبت ذلك مرارًا وتكرارًا للجماهير: فإنّ روح المنافسة والقيادة ستؤدي بالتأكيد إلى النجاح. قم بالتداول بنفس الطريقة التي يلعب بها المحترفون الرياضيون اللعبة: بثقة ونشاط. احتفظ بـ "ترخيص دخول" من نادي بوروسيا دورتموند لكرة القدم وكن في الصدارة مع إنستافوركس!
Bitcoin dropped below $18,200 over the last week before finding support and bouncing back to $19,500, producing a bullish candlestick pattern on the daily chart. The crypto seems to have carved a higher low around the $18,600 level and is now preparing to push higher towards at least $22,900. Bulls are looking to be back in control by holding above the $18,200 mark.
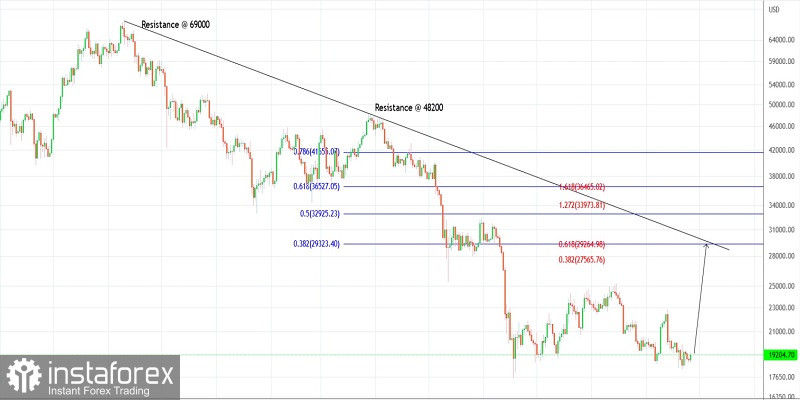
Bitcoin has carved a larger degree bearish boundary between $69,000 and $17,500 as can be seen on the daily chart presented here. The recent downswing being worked upon is between $48,200 and $17,500. A potential target is seen towards the $29,500 level, which is also the 0.382 Fibonacci retracement of the above downswing. Strong resistance is expected to be seen there.
There is also the Fibonacci convergence seen around $29,500 which increases the probability of a strong bearish reversal. Alternatively, if the price continues to slide from there, it could break below $17,500 and slide further towards at least $15,000. As long as the $17,500 support stays intact, prices are likely to move higher.
Potential rally towards $29,500 against $17,500
Good luck!
*The market analysis posted here is meant to increase your awareness, but not to give instructions to make a trade.
InstaSpot analytical reviews will make you fully aware of market trends! Being an InstaSpot client, you are provided with a large number of free services for efficient trading.


