


我们的团队有超过700万的操盘手!
我们每天都在一起努力改善交易。我们得到了很高的成绩,并继续前进。
世界各地数以百万计的操盘手的认可是我们工作的最大赞赏! 您做出了您的选择,我们将尽一切努力来满足您的期望!
我们是一个共同的伟大团队!
InstaSpot. 自豪地为您工作!


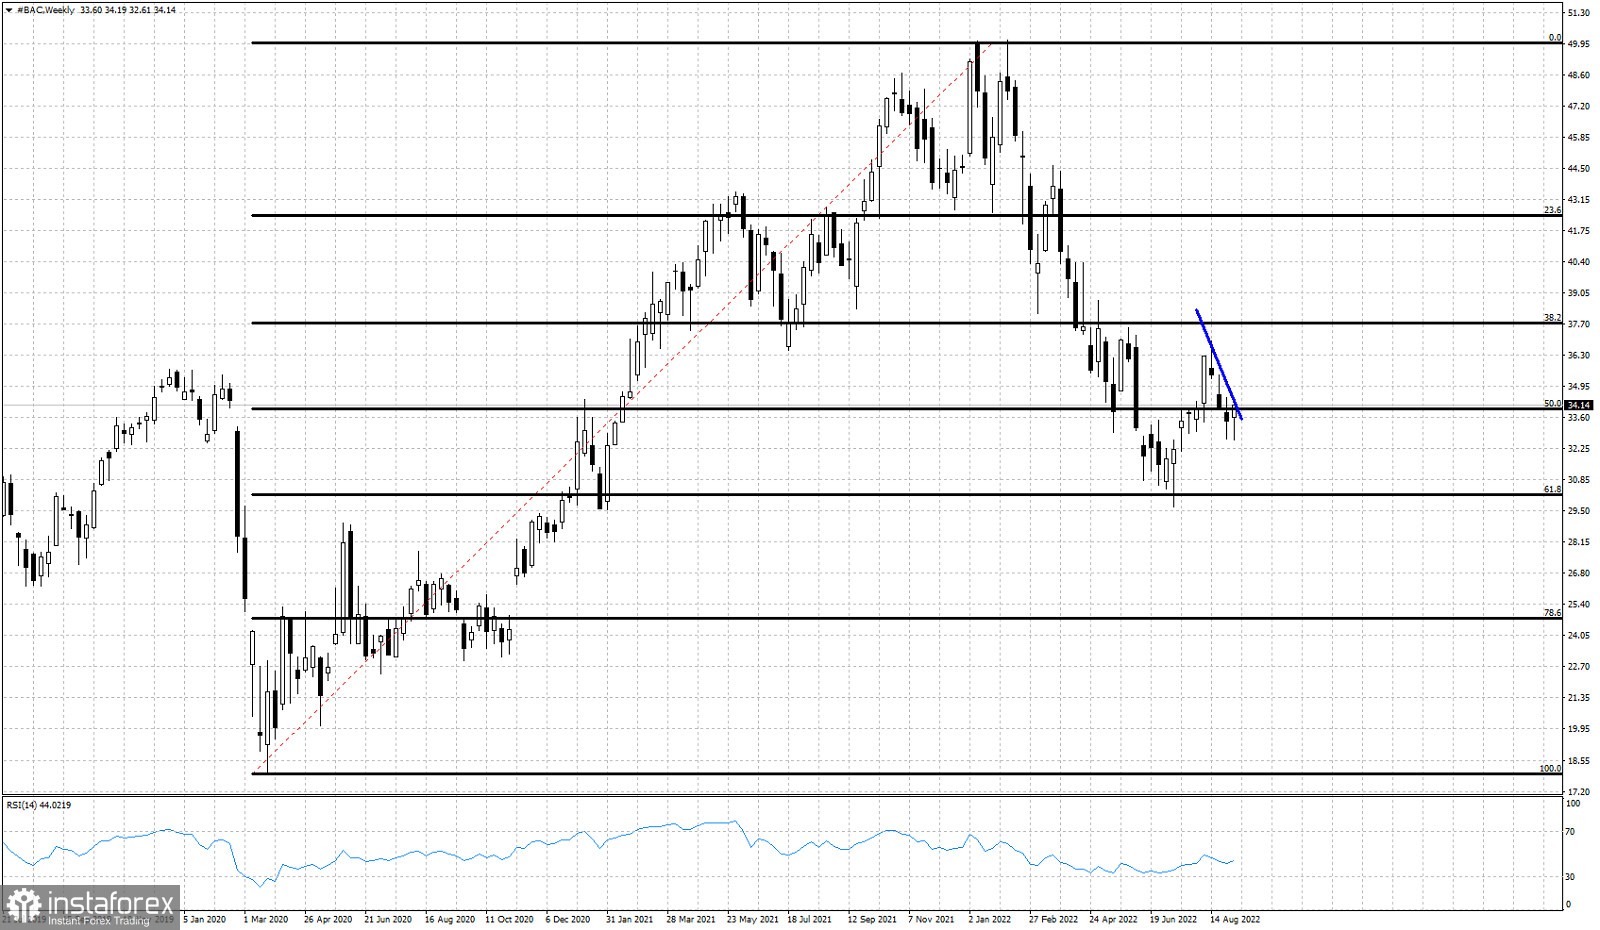
Black lines- Fibonacci retracements
Blue line- short-term resistance
BAC share price completed a major pull back in July around $30. Price bounced strongly as expected towards $37 and has turned back down towards $34-$33. Price has the potential to make a new higher high towards $39. Looking at the weekly chart we remind ourselves where the big decline stopped. At the 61.8% Fibonacci retracement. Bulls are now trying to form a higher low in order to start their attack for a new higher high. Short-term resistance is at $34,50. A break above this level will be the first step towards starting a new upward move.
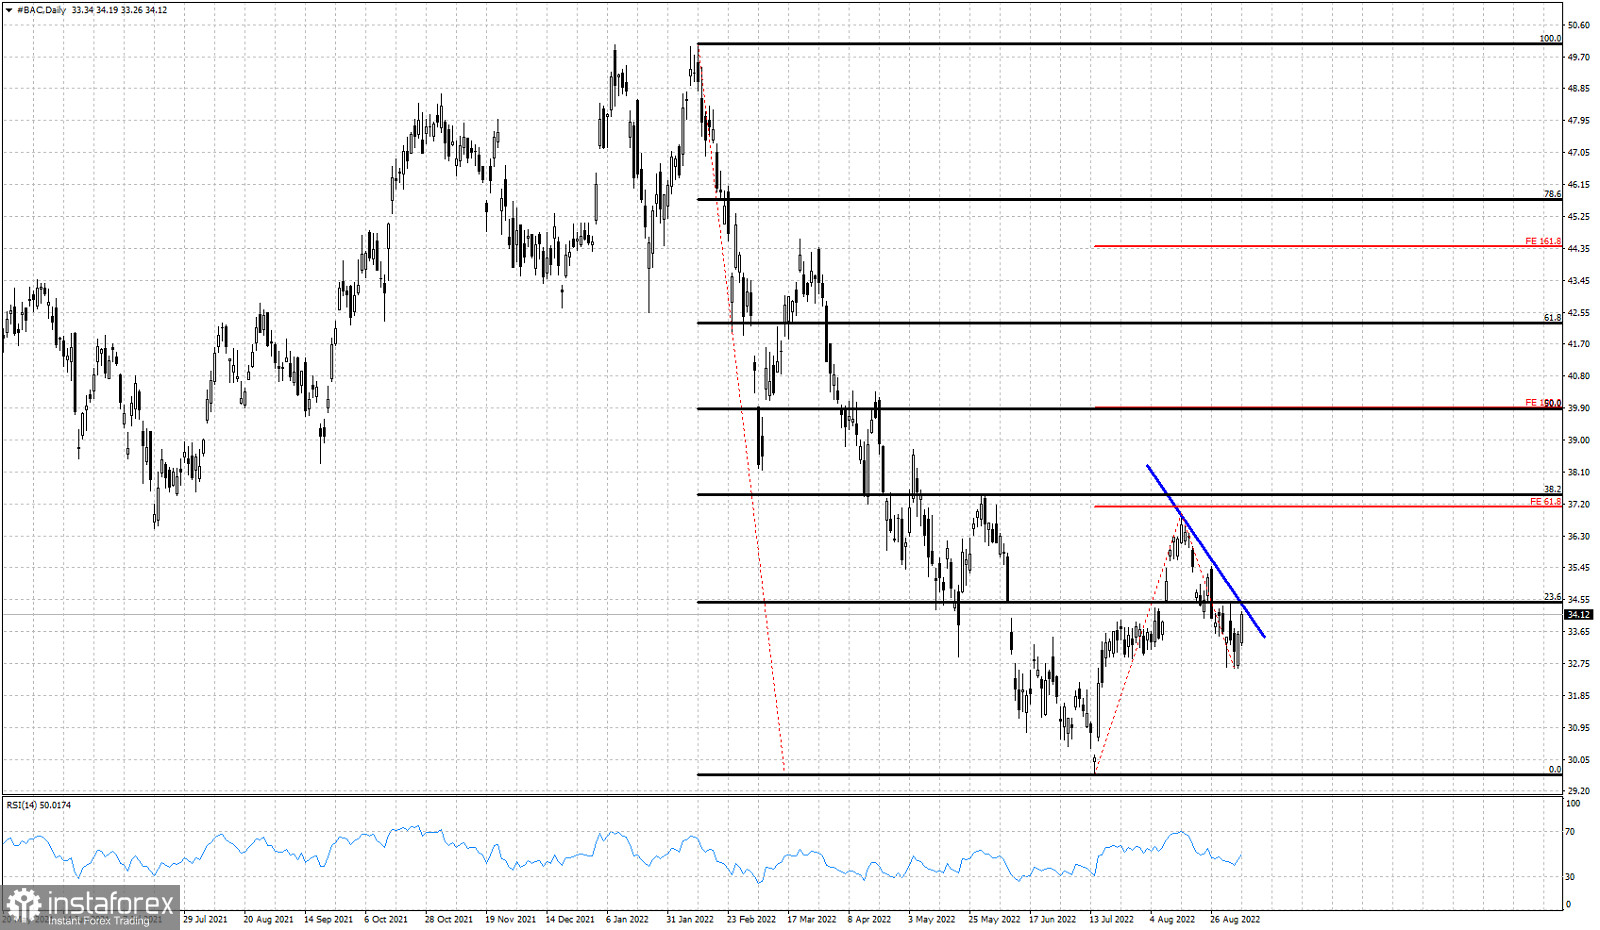
Blue line- short-term resistance
Red lines- Fibonacci extension targets
BAC share price has so far retraced 38% of the entire decline. There are increased chances that a new upward move will start soon and we would expect price to make at least an equal upward movement relative to the first upward move. This would bring BAC share price towards the 61.8% Fibonacci retracement and the $39-$40 level. Support is at $32,62 and as long as bulls hold this level, they will have hopes for a move higher.Short-term resistance at $34.50 is the first step bulls will need to overcome and the $36.93 level as a second step.
*这里的市场分析是为了增加您对市场的了解,而不是给出交易的指示。
InstaSpot分析评论将让您充分了解市场趋势! 作为InstaSpot的客户,您将获得大量的免费服务以实现有效的交易。


