


我们的团队有超过700万的操盘手!
我们每天都在一起努力改善交易。我们得到了很高的成绩,并继续前进。
世界各地数以百万计的操盘手的认可是我们工作的最大赞赏! 您做出了您的选择,我们将尽一切努力来满足您的期望!
我们是一个共同的伟大团队!
InstaSpot. 自豪地为您工作!


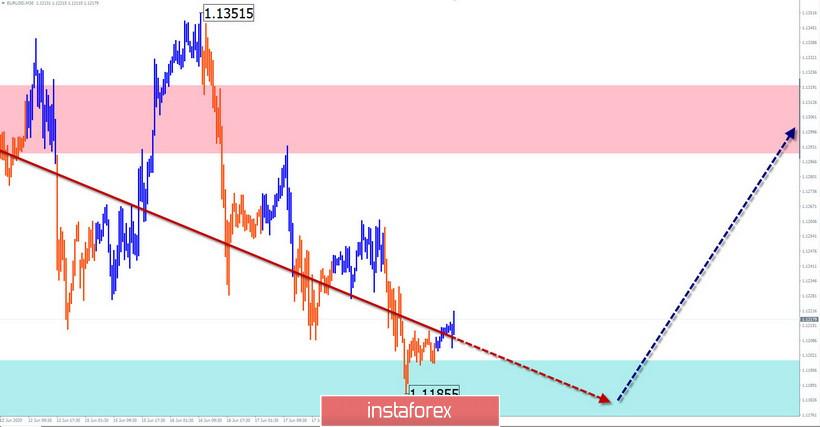
EUR/USD
Analysis:
The direction of the wave trend since March looks to the north of the price chart. Since May 7, the final part of the wave model (C) has formed. Within its framework, a correction in the form of a stretched plane has been developing since the beginning of this month. The correction structure looks complete. There are no signals of an imminent rate reversal on the chart at the time of analysis.
Forecast:
Today, the price is expected to move mainly in the lateral plane, along the calculated support. By the end of the day, the probability of a change in the exchange rate and a rise in the pair's rate increases. A break above the resistance zone is unlikely today.
Potential reversal zones
Resistance:
- 1.1290/1.1320
Support:
- 1.1200/1.1170
Recommendations:
There are no conditions for selling the euro today. We recommend tracking reversal signals to find an entry in a long position.
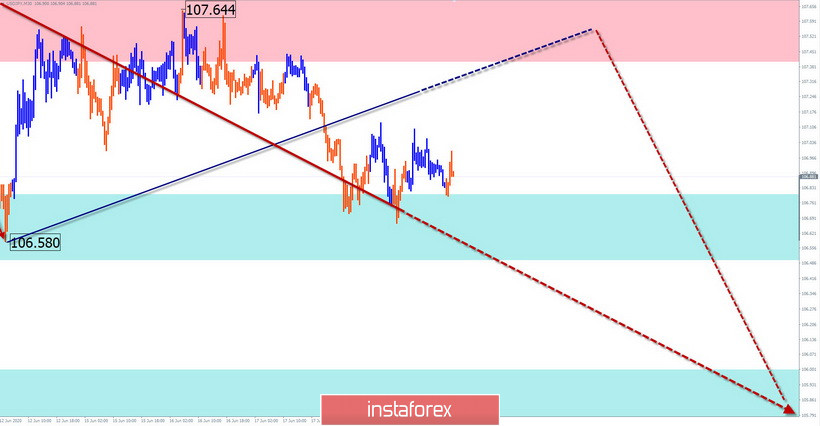
USD/JPY
Analysis:
The direction of the price movement of the Japanese yen in the last 3 months is set by a large-scale correction wave. From June 5, the final ascending section is formed. In recent days, an intermediate correction has been made. The last part of its structure is missing.
Forecast:
Today in the first half of the day, the probability of a short-term rise remains. The growth boundary is the calculated resistance. Then you should wait for a return to the downward rate. If the support breaks through, the next zone will be the target of the decline.
Potential reversal zones
Resistance:
- 107.40/107.70
Support:
- 106.80/106.50
Recommendations:
Until the end of the current wave, the priority is to sell the instrument. In the European session, short-term purchases with a reduced lot are possible.
Explanation: In the simplified wave analysis (UVA), waves consist of 3 parts (A-B-C). The last incomplete wave is analyzed. The solid background of the arrows shows the formed structure, and the dotted one shows the expected movements.
Note: The wave algorithm does not take into account the duration of the tool movements in time!
*这里的市场分析是为了增加您对市场的了解,而不是给出交易的指示。
InstaSpot分析评论将让您充分了解市场趋势! 作为InstaSpot的客户,您将获得大量的免费服务以实现有效的交易。


