


ตำนานแห่งทีม InstaSpot!
ที่สุด! คุณคิดว่าอะไรคือการทำให้รู้สึกฮึกเหิมกันละ? แต่พวกเราควรจะเรียกคนที่กลายมาเป็นชาวเอเชียคนแรกที่คว้าแชมป์หมากรุกระดับโลกรุ่นเยาวชนอายุ 18 ปี และยังกลายมาเป็นแกรนด์มาสเตอร์ชาวอินเดียคนแรกด้วยอายุ 19ปีเท่านั้น? นั้นเป็นจุดเริ่มต้นของเส้นทางสู่การเป็นแชมป์โลกสำหรับคุณ Viswanathan Anand คนที่กลายมาเป็นส่วนหนึ่งในหน้าประวติศาสตร์หมากรุกไปตลาดกาล ตอนนี้ก็มีอีกตำนานมาอยู่ในทีม InstaSpot แล้ว!


Borussia เป็นหนึ่งในสโมสรฟุตบอลขึ้นชื่อในประเทศเยอรมนี ที่ได้พิสูจน์ให้กับเหล่าแฟนๆเห็นแล้วถึงจิตวิญญาณของการแข่งขัน และการขึ้นมาสู่จุดสูงสุด เพื่อจะมุ่งหน้าสู่ความสำเร็จ การเทรดเองก็เหมือนกับการเล่นกีฬาอย่างมืออาชีพในการแข่งขัน โดยต้องมีความมั่นใจและการไม่หยุดนิ่ง เพื่อที่จะได้ "ผ่าน" จากสโมสร Borussia FC และขึ้นมาอยู่ในอันดับต้นไปพร้อมกับ InstaSpot!

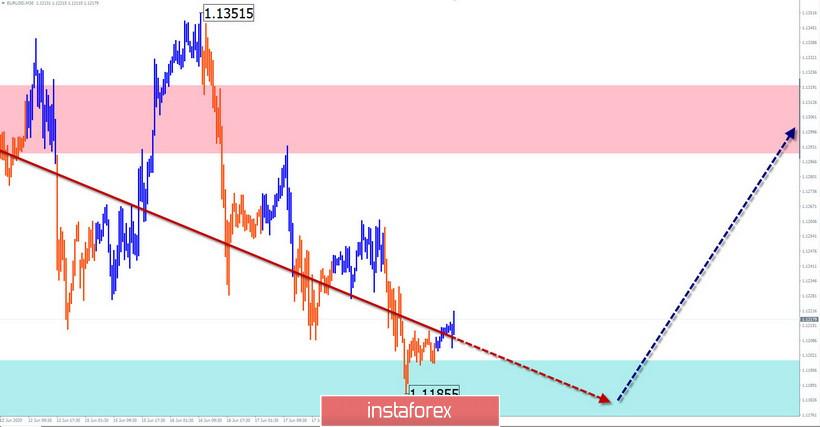
EUR/USD
Analysis:
The direction of the wave trend since March looks to the north of the price chart. Since May 7, the final part of the wave model (C) has formed. Within its framework, a correction in the form of a stretched plane has been developing since the beginning of this month. The correction structure looks complete. There are no signals of an imminent rate reversal on the chart at the time of analysis.
Forecast:
Today, the price is expected to move mainly in the lateral plane, along the calculated support. By the end of the day, the probability of a change in the exchange rate and a rise in the pair's rate increases. A break above the resistance zone is unlikely today.
Potential reversal zones
Resistance:
- 1.1290/1.1320
Support:
- 1.1200/1.1170
Recommendations:
There are no conditions for selling the euro today. We recommend tracking reversal signals to find an entry in a long position.
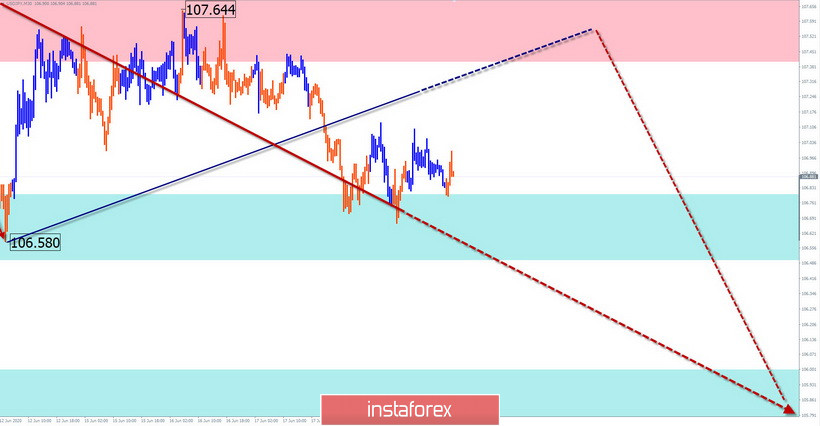
USD/JPY
Analysis:
The direction of the price movement of the Japanese yen in the last 3 months is set by a large-scale correction wave. From June 5, the final ascending section is formed. In recent days, an intermediate correction has been made. The last part of its structure is missing.
Forecast:
Today in the first half of the day, the probability of a short-term rise remains. The growth boundary is the calculated resistance. Then you should wait for a return to the downward rate. If the support breaks through, the next zone will be the target of the decline.
Potential reversal zones
Resistance:
- 107.40/107.70
Support:
- 106.80/106.50
Recommendations:
Until the end of the current wave, the priority is to sell the instrument. In the European session, short-term purchases with a reduced lot are possible.
Explanation: In the simplified wave analysis (UVA), waves consist of 3 parts (A-B-C). The last incomplete wave is analyzed. The solid background of the arrows shows the formed structure, and the dotted one shows the expected movements.
Note: The wave algorithm does not take into account the duration of the tool movements in time!
*บทวิเคราะห์ในตลาดที่มีการโพสต์ตรงนี้ เพียงเพื่อทำให้คุณทราบถึงข้อมูล ไม่ได้เป็นการเจาะจงถึงขั้นตอนให้คุณทำการซื้อขายตาม
บทวิเคราะห์ของทาง InstaSpot จะทำให้คุณทราบถึงแนวโน้มของตลาด! ในการที่เป็นลูกค้าของทาง InstaSpot นั้นคุณจะได้รับการบริการเพื่อการซื้อขายอย่างเต็มประสิทธิภาพอย่างมากมาย


