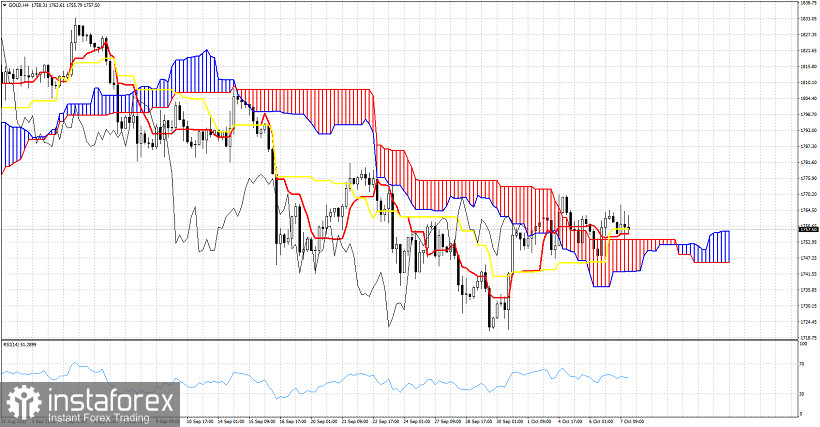
Gold price is at $1,756. The Ichimoku cloud indicator provides a contradicting result between the 4 hour chart and the Daily chart. This reflects the indecision and the lack of a clear direction in the specific market.
In the 4 hour chart Gold price is trading above the Kumo (cloud) and above both the tenkan-sen (Red line indicator) and the kijun-sen (yellow line indicator). However the tenkan-sen is below the kijun-sen. This is not a clear bullish confirmation, but staying above the cloud in the 4 hour chart is key for bulls to be able to change short-term trend to bullish. If the tenkan-sen crosses above the kijun-sen and price is above the Kumo, then we get a strong bullish signal.
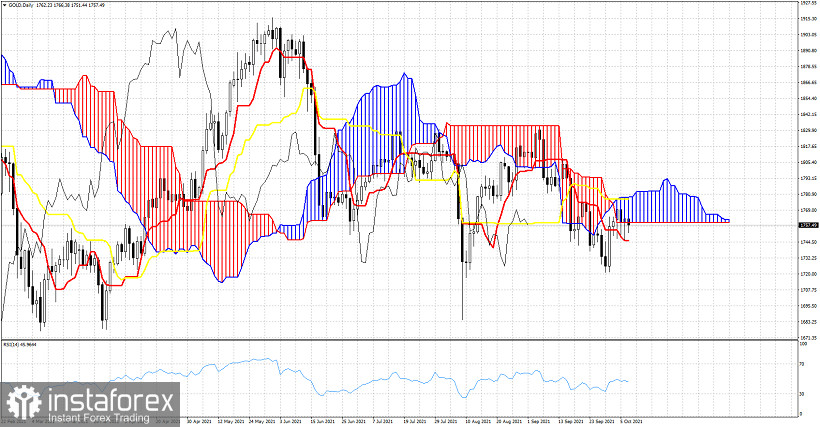
In the Daily chart we see Gold price trying to crawl inside the Kumo in order to change trend to neutral. Price is below the kijun-sen but above the tenkan-sen. The tenkan-sen provides support at $1,745. Breaking below this level will provide a bearish signal. Bulls need to push price above the cloud and the kijun-sen resistance at $1,778. If this happens then we will get an important bullish signal.
*这里的市场分析是为了增加您对市场的了解,而不是给出交易的指示。
立即从分析师的建议受益
充值交易账户
开设交易账户
InstaSpot分析评论将让您充分了解市场趋势! 作为InstaSpot的客户,您将获得大量的免费服务以实现有效的交易。