


الأسطورة فى فريق إنستافوركس!
الأسطورة! هل تعتقد أن هذا هو الخطاب المنمق؟ ولكن كيف ينبغي أن نطلق على الرجل، الذي أصبح أول آسيوي يفوز ببطولة العالم للشطرنج للشباب بعمر 18 سنة والذي أصبح أول أستاذ كبير هندي في سن 19؟ وكانت هذه بداية طريق صعب إلى لقب بطل العالم لـ فيسواناثان أناند، الرجل الذي أصبح جزءًا من تاريخ الشطرنج إلى الأبد. والآن أسطورة آخر في فريق إنستافوركس!


يعتبر بوروسيا دورتموند أحد أكثر أندية كرة القدم حصولاً على الألقاب في ألمانيا، وقد أثبت ذلك مرارًا وتكرارًا للجماهير: فإنّ روح المنافسة والقيادة ستؤدي بالتأكيد إلى النجاح. قم بالتداول بنفس الطريقة التي يلعب بها المحترفون الرياضيون اللعبة: بثقة ونشاط. احتفظ بـ "ترخيص دخول" من نادي بوروسيا دورتموند لكرة القدم وكن في الصدارة مع إنستافوركس!
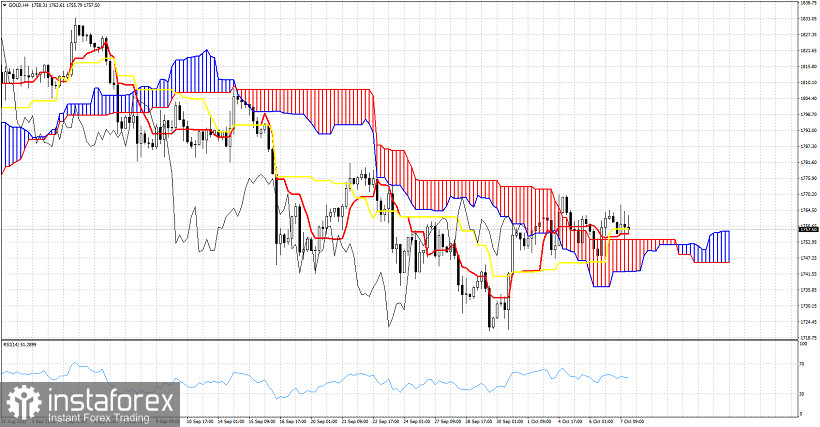
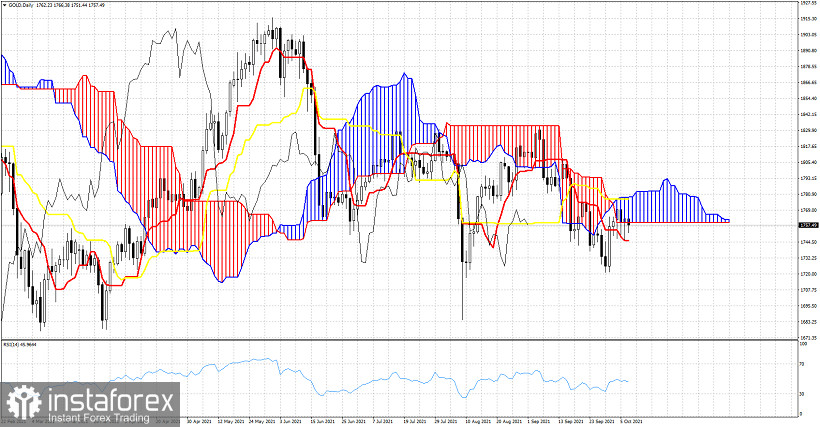
Gold price is at $1,756. The Ichimoku cloud indicator provides a contradicting result between the 4 hour chart and the Daily chart. This reflects the indecision and the lack of a clear direction in the specific market.
*The market analysis posted here is meant to increase your awareness, but not to give instructions to make a trade.
InstaSpot analytical reviews will make you fully aware of market trends! Being an InstaSpot client, you are provided with a large number of free services for efficient trading.


