




Our team has over 7,000,000 traders!
Every day we work together to improve trading. We get high results and move forward.
Recognition by millions of traders all over the world is the best appreciation of our work! You made your choice and we will do everything it takes to meet your expectations!
We are a great team together!
InstaSpot. Proud to work for you!





Actor, UFC 6 tournament champion and a true hero!
The man who made himself. The man that goes our way.
The secret behind Taktarov's success is constant movement towards the goal.
Reveal all the sides of your talent!
Discover, try, fail - but never stop!
InstaSpot. Your success story starts here!

Bitcoin rose $18,000 in just a few days, then entered a flat phase. This may be a pause before a new surge — Bitcoin often halts within strong trends and then resumes a powerful move even without a clear correction. Thus, Bitcoin's current inability to continue growth does not mean the local upward impulse is finished. Recall that neither Ether nor Bitcoin have yet broken their downtrends that began last year, so the current upward impulse should be regarded as local. Note also that a flat has formed on the 4-hour TF, and on the daily TF there is a high probability of a flat between $60,000 and $82,500. In addition, on the daily TF Bitcoin may take liquidity from the May 6 high and work the nearest bearish FVG without breaking the downward structure. In our view, the technical picture remains firmly bearish.
This week the US will publish the August inflation report, the last major release before the Federal Reserve meeting. Bitcoin's dynamics and investor appeal depend, in part, on the Fed's monetary policy: the looser the policy, the better for risk assets. There is currently no talk of cutting the key rate, even as the market has expected a rate hike for three months — not ideal for Bitcoin. We assess the probability of Fed tightening as low. We believe the US labor market is not in good shape and the US economy has been slowing for several quarters. Last week, Christopher Waller and John Williams said they see no reason to tighten policy. Therefore, we rate the odds of a September Fed hike as low.
Inflation can raise or lower those odds. If consumer prices on Friday print above forecasts, the probability of hawkish measures later this year will increase; if below, they will become nearly zero. For Bitcoin, therefore, the best outcome is as low inflation as possible.
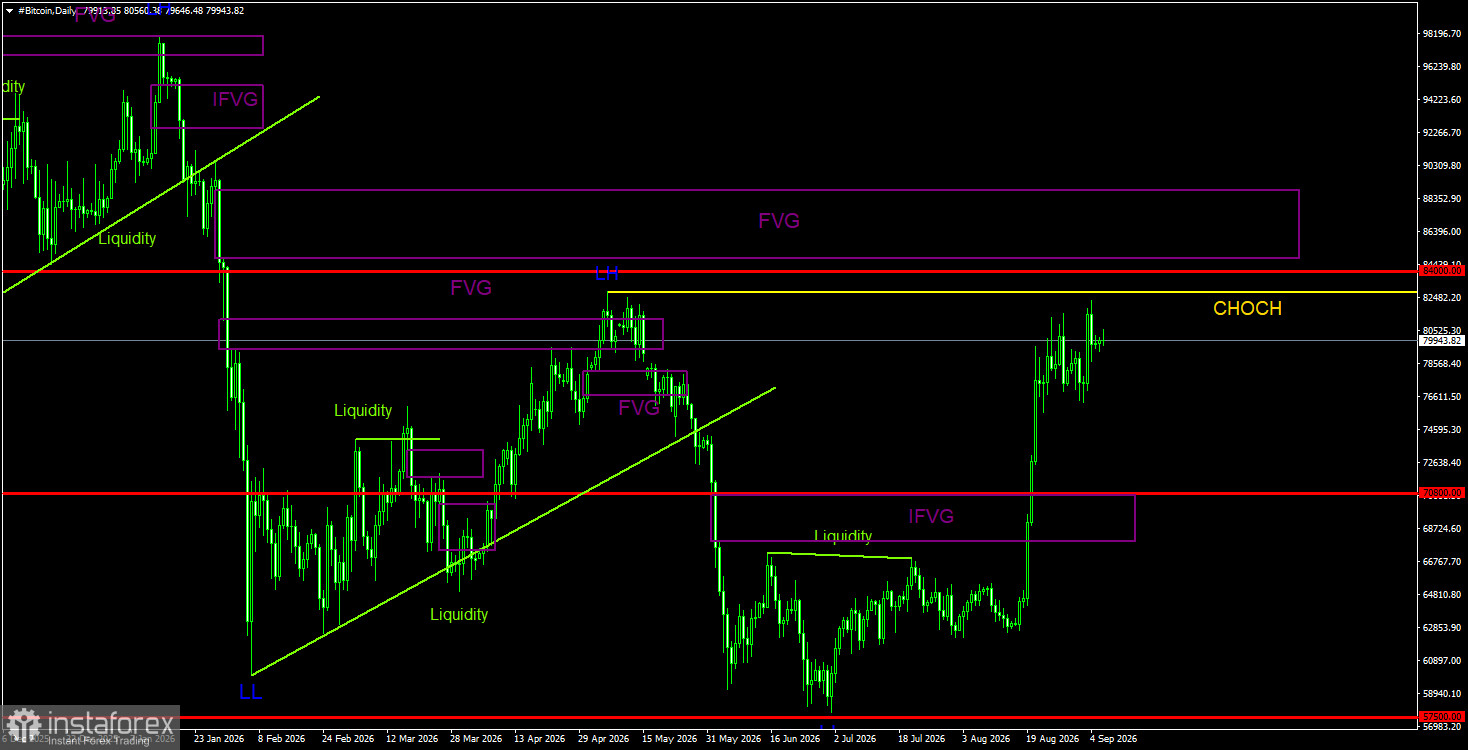
On the daily TF, Bitcoin continues forming a downtrend. The trend structure is identified as bearish, and the CHOCH line sits at $82,800, where the last Lower High (LH) formed. Only above this level can the downtrend be considered complete. The last and only bearish FVG was pierced, turning into a bullish IFVG; thus, that area may serve as a POI for longs in the future. Bitcoin has not yet broken the downtrend, but over the past three weeks the odds of the bearish trend ending have materially increased. There is a high probability of a flat between $60,000 and $82,500, which means price could take liquidity from the last LH and then start a new decline.
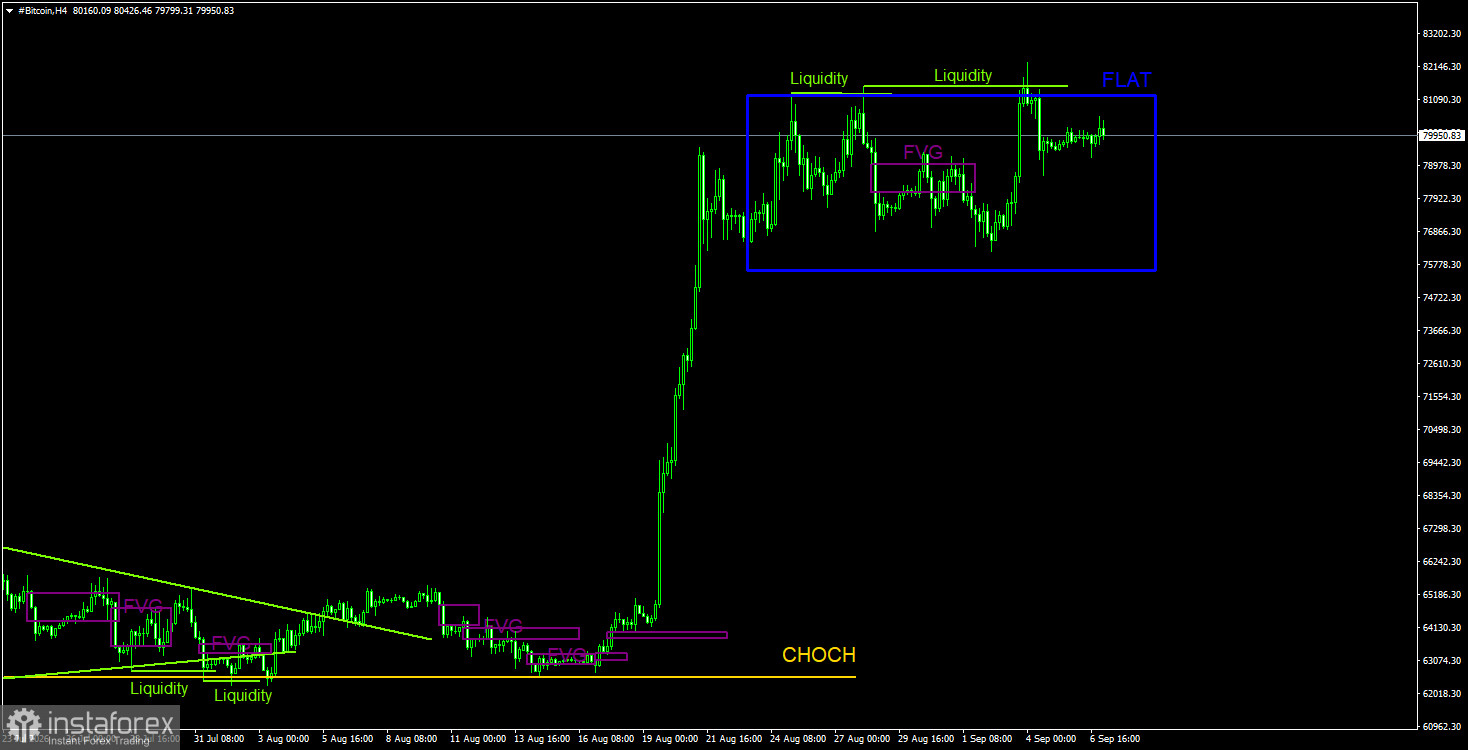
On the 4-hour TF, Bitcoin is in a clear flat and has twice taken liquidity to the sell side, forming two deviations of the channel's upper boundary. Traders therefore received at least two sell signals, allowing for the expectation of a decline with targets at 50% and 100% of the sideways channel width. After two deviations of the upper boundary, we would say the probability of a new strong drop is higher than a breakout of the flat to the upside. However, the latest leg up was an obvious pump, so traders must not forget to use a stop-loss.
Bitcoin continues to form a downtrend despite last week's strong rally. We continue to expect a decline with a target of $57,500 (the 61.8% Fibonacci retracement of the three-year uptrend), although this level has effectively already been tested. We do not consider the downtrend finished. The current rise looks little like a corrective move and therefore is not a strong argument to open long positions. The move resembles a pump. Liquidity could be taken from the $82,850 high, potentially triggering a new leg of the downtrend. On the 4-hour TF, another fall may follow the second liquidity grab at recent highs (deviation).
*এখানে পোস্ট করা মার্কেট বিশ্লেষণ আপনার সচেতনতা বৃদ্ধির জন্য প্রদান করা হয়, ট্রেড করার নির্দেশনা প্রদানের জন্য প্রদান করা হয় না।
ইন্সটাফরেক্স বিশ্লেষণমূলক পর্যালোচনাগুলো আপনাকে মার্কেট প্রবণতা সম্পর্কে পুরোপুরি সচেতন করবে! ইন্সটাফরেক্সের একজন গ্রাহক হওয়ায়, দক্ষ ট্রেডিং এর জন্য আপনাকে অনেক সেবা বিনামূল্যে প্রদান করা হয়।


