




Our team has over 7,000,000 traders!
Every day we work together to improve trading. We get high results and move forward.
Recognition by millions of traders all over the world is the best appreciation of our work! You made your choice and we will do everything it takes to meet your expectations!
We are a great team together!
InstaSpot. Proud to work for you!





Actor, UFC 6 tournament champion and a true hero!
The man who made himself. The man that goes our way.
The secret behind Taktarov's success is constant movement towards the goal.
Reveal all the sides of your talent!
Discover, try, fail - but never stop!
InstaSpot. Your success story starts here!

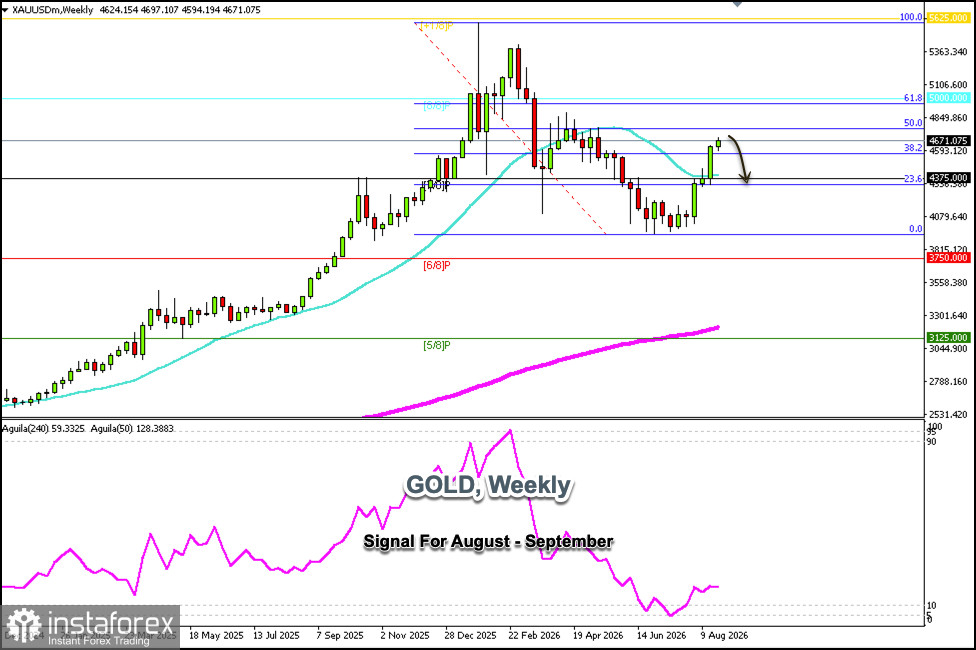
The weekly chart for gold shows that it has upside potential and, over the past four consecutive weeks, has been rising, gaining approximately $600, from $4,030 to its current high.
From a technical perspective, we expect a correction in the coming days toward the 21-day simple moving average (SMA), which stands at $4,375.
If gold remains below $4,681 in the coming days—where there is strong daily resistance—we could look for selling opportunities with targets at the 38.2% Fibonacci level, around $4,593. Finally, we expect strong support around the 23.6% Fibonacci level, which also coincides with the Murray 7/8 level, around $4,375.
On the upside, according to the weekly chart, gold is likely to reach the psychological level of $5,000, which also coincides with the 61.8% Fibonacci level.
Therefore, we believe this could be a good point to continue buying after a technical correction. However, we must keep in mind that gold has been in an uptrend for a month and that a strong technical correction is more likely to occur in the coming days.
Our trading plan for the coming days will be to sell below $4,690, with targets at $4,590, $4,490, and $4,375.
*এখানে পোস্ট করা মার্কেট বিশ্লেষণ আপনার সচেতনতা বৃদ্ধির জন্য প্রদান করা হয়, ট্রেড করার নির্দেশনা প্রদানের জন্য প্রদান করা হয় না।
ইন্সটাফরেক্স বিশ্লেষণমূলক পর্যালোচনাগুলো আপনাকে মার্কেট প্রবণতা সম্পর্কে পুরোপুরি সচেতন করবে! ইন্সটাফরেক্সের একজন গ্রাহক হওয়ায়, দক্ষ ট্রেডিং এর জন্য আপনাকে অনেক সেবা বিনামূল্যে প্রদান করা হয়।


