




Tim kami memiliki lebih dari 7.000.000 trader!
Setiap harinya kami bekerja sama untuk meningkatkan trading. Kami memperoleh hasil tinggi dan terus bergerak maju.
Pengakuan dari jutaan trader diseluruh dunia merupakan apresiasi terbaik dari kerja kami! Anda membuat pilihan anda dan kami akan melakukan semua yang dibutuhkan untuk memenuhi ekspektasi anda!
We are a great team together!
InstaSpot. Bangga bekerja bersama anda!





Seorang Aktor, juara 6 turnamen UFC dan pahlawan sesungguhnya!
Pria yang berhasil. Pria yang berusaha keras.
Rahasia dibalik kesuksesan Taktarov adalah pergerakan konstan menuju target.
Tunjukkan seluruh sisi dari bakat anda!
Temukan, coba, gagal - namun jangan pernah berhenti!
InstaSpot. Cerita sukses anda dimulai disini!

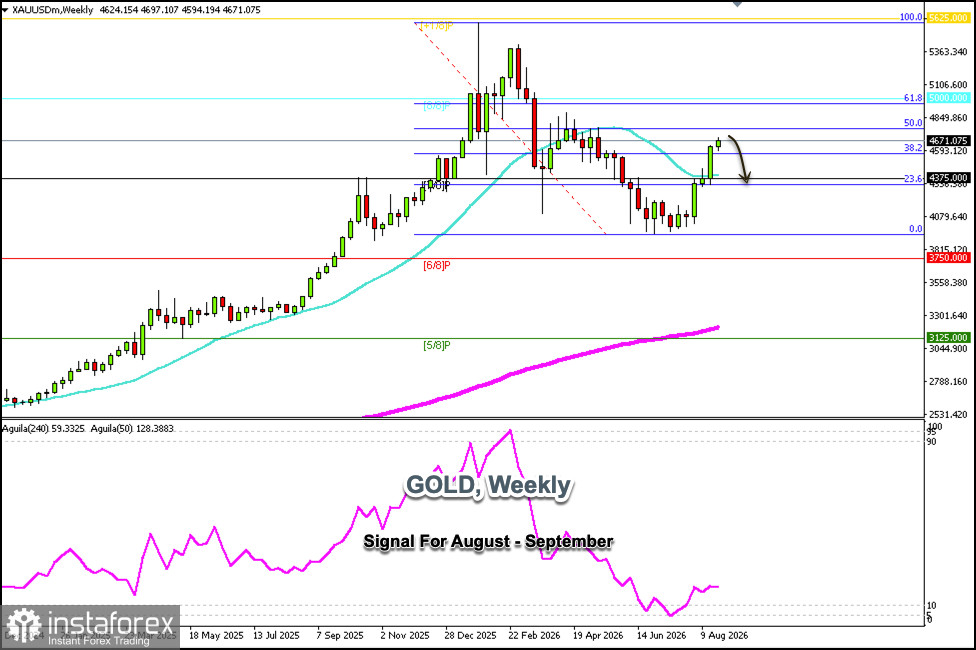
The weekly chart for gold shows that it has upside potential and, over the past four consecutive weeks, has been rising, gaining approximately $600, from $4,030 to its current high.
From a technical perspective, we expect a correction in the coming days toward the 21-day simple moving average (SMA), which stands at $4,375.
If gold remains below $4,681 in the coming days—where there is strong daily resistance—we could look for selling opportunities with targets at the 38.2% Fibonacci level, around $4,593. Finally, we expect strong support around the 23.6% Fibonacci level, which also coincides with the Murray 7/8 level, around $4,375.
On the upside, according to the weekly chart, gold is likely to reach the psychological level of $5,000, which also coincides with the 61.8% Fibonacci level.
Therefore, we believe this could be a good point to continue buying after a technical correction. However, we must keep in mind that gold has been in an uptrend for a month and that a strong technical correction is more likely to occur in the coming days.
Our trading plan for the coming days will be to sell below $4,690, with targets at $4,590, $4,490, and $4,375.
*Analisis pasar yang diposting disini dimaksudkan untuk meningkatkan pengetahuan Anda namun tidak untuk memberi instruksi trading.
Tinjauan analitis InstaSpot akan membuat Anda menyadari sepenuhnya tren pasar! Sebagai klien InstaSpot, Anda dilengkapi dengan sejumlah besar layanan gratis untuk trading yang efisien.


