


Our team has over 7,000,000 traders!
Every day we work together to improve trading. We get high results and move forward.
Recognition by millions of traders all over the world is the best appreciation of our work! You made your choice and we will do everything it takes to meet your expectations!
We are a great team together!
InstaSpot. Proud to work for you!


Actor, UFC 6 tournament champion and a true hero!
The man who made himself. The man that goes our way.
The secret behind Taktarov's success is constant movement towards the goal.
Reveal all the sides of your talent!
Discover, try, fail - but never stop!
InstaSpot. Your success story starts here!

Markets follow a natural cycle: trends give way to consolidations, and consolidations lead to new trends.
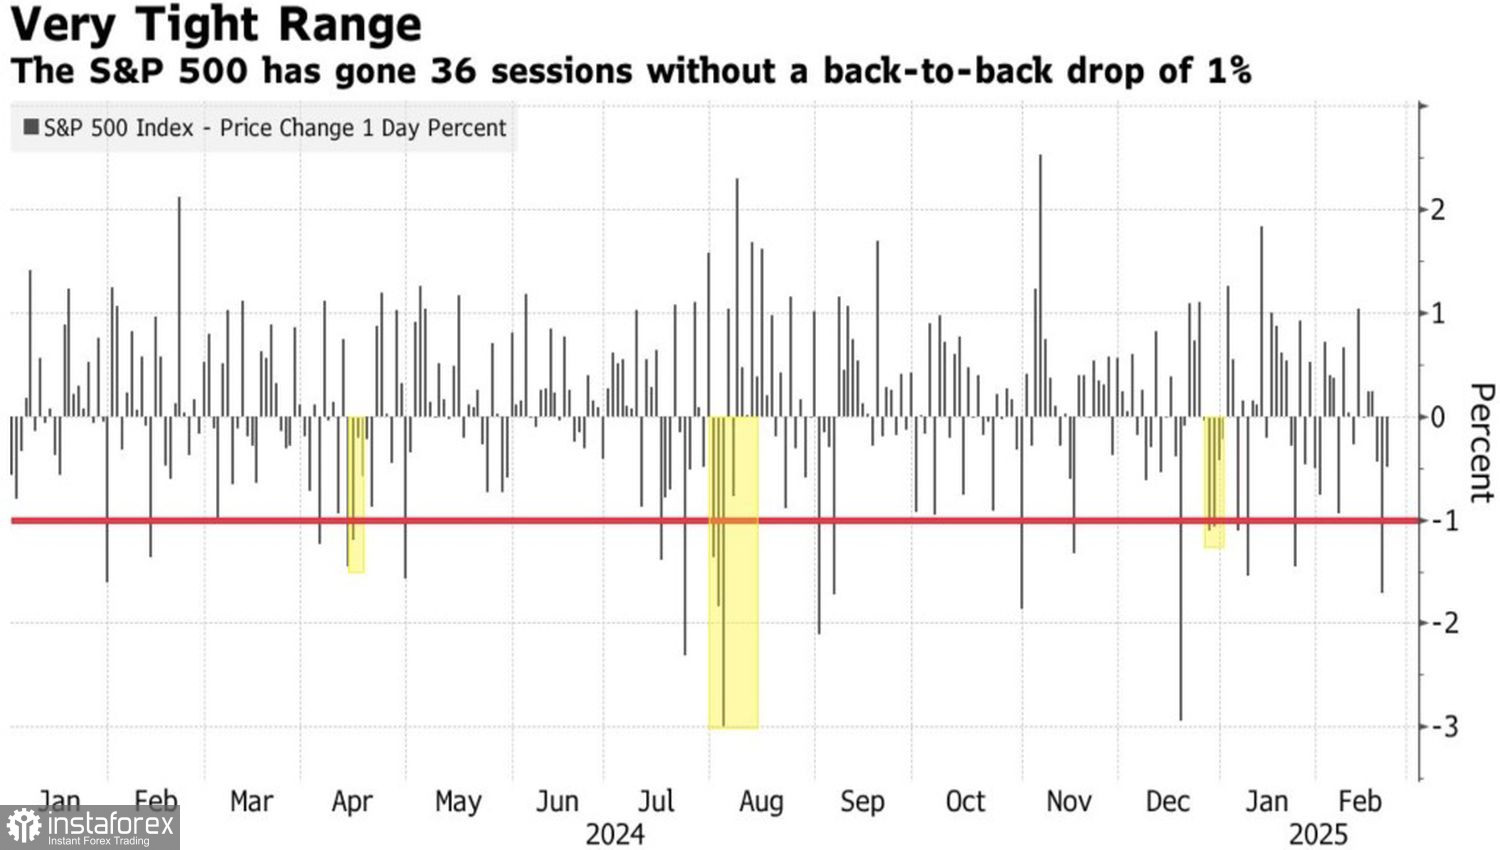
Before the sell-off on February 23–24, the S&P 500 had gone 35 consecutive trading sessions without a 1% decline, marking its longest streak since December. This has happened only three times in 2024. Since the November presidential election, the broad stock index had been stuck in a tight 4% trading range—the narrowest since 2017. A breakout was inevitable, and bulls fled the battlefield.
S&P 500's performance
The market was falling ahead of NVIDIA's earnings report, despite expectations that the company's earnings would exceed forecasts. Strong economic data, corporate earnings which are twice higher than Wall Street estimates, and even a bullish shift from Morgan Stanley—all failed to support US stocks.
Even Morgan Stanley, which was previously bearish, now claims that the US stock market's underperformance compared to Europe and other regions won't last long. The S&P 500, they argue, remains the highest-quality index with the best profit potential.
According to Principal Asset Management, since 1965, 10%+ corrections in the S&P 500 have primarily been caused by either a hawkish Federal Reserve's policy shift, or prolonged high interest rates. Something similar is happening now, as derivatives markets don't expect rate cuts before June. However, the situation differs significantly—no one is even hinting at a hard landing.
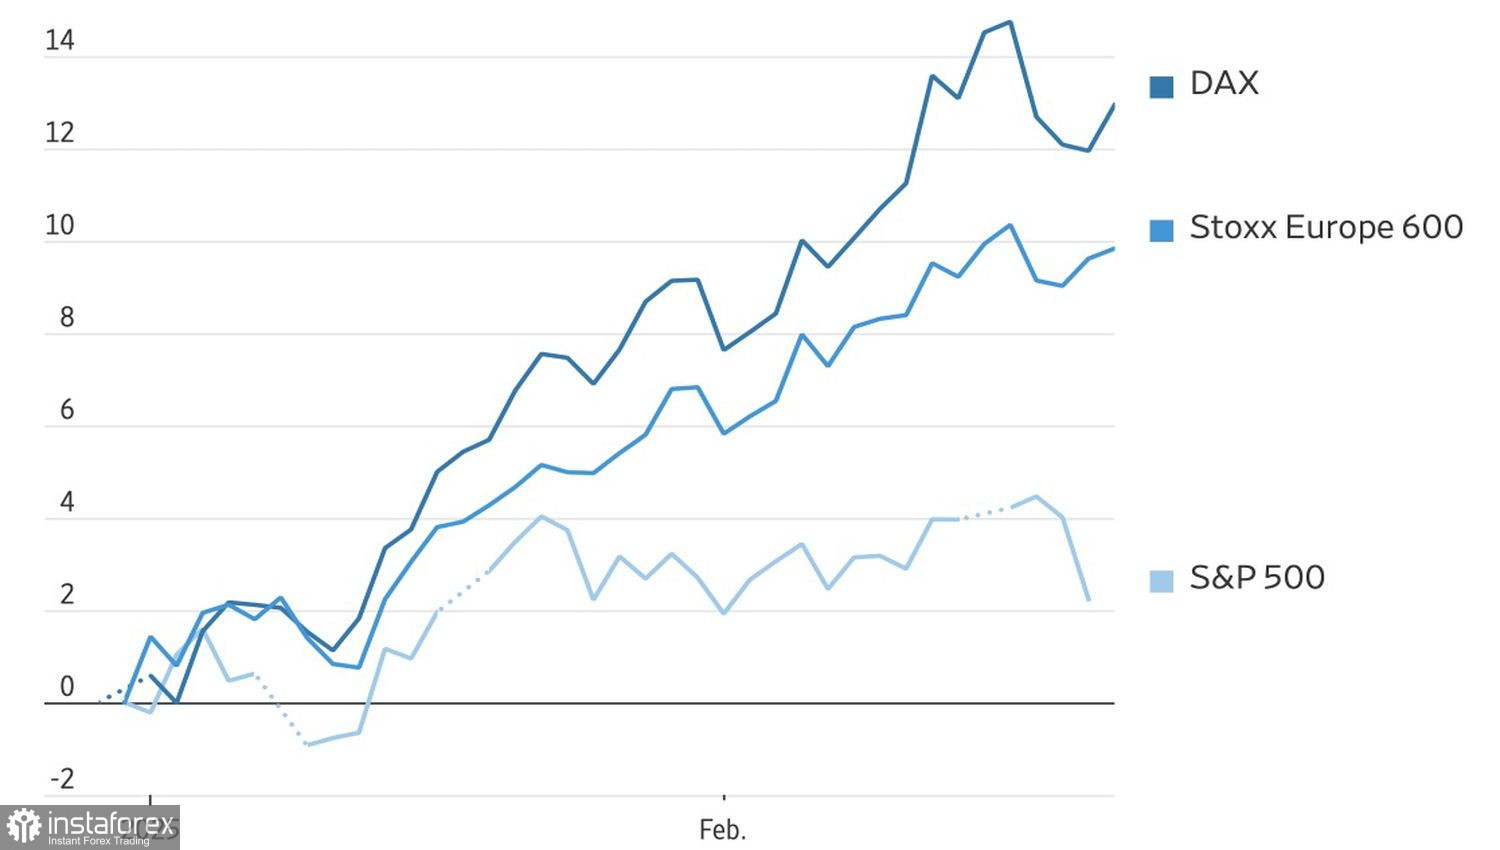
S&P 500 and European stock index performance
The key drivers of the S&P 500 pullback include Donald Trump's confirmation that tariffs on Mexico and Canada will proceed as planned; the victory of Germany's Christian Democratic Union (CDU) in parliamentary elections; and investors' belief in an imminent resolution of the conflict in Ukraine. For a long time, the S&P 500 rallied as markets grew indifferent to Trump's tariff threats, which could slow the US economy.
However, the clock is ticking:
March 1: 25% tariffs on Mexico and Canada could take effect.
March 12: Steel and aluminum duties—to which the EU has promised retaliation.
April 1: Reciprocal tariffs with China are set to roll out.
Meanwhile, 10% duties on Chinese imports remain in place.
The CDU's victory under Friedrich Merz sent European stock indices, led by the DAX 40, soaring. This accelerated capital outflows from the US to Europe, reinforcing the narrative of waning US market dominance and diminished faith in American tech giants.
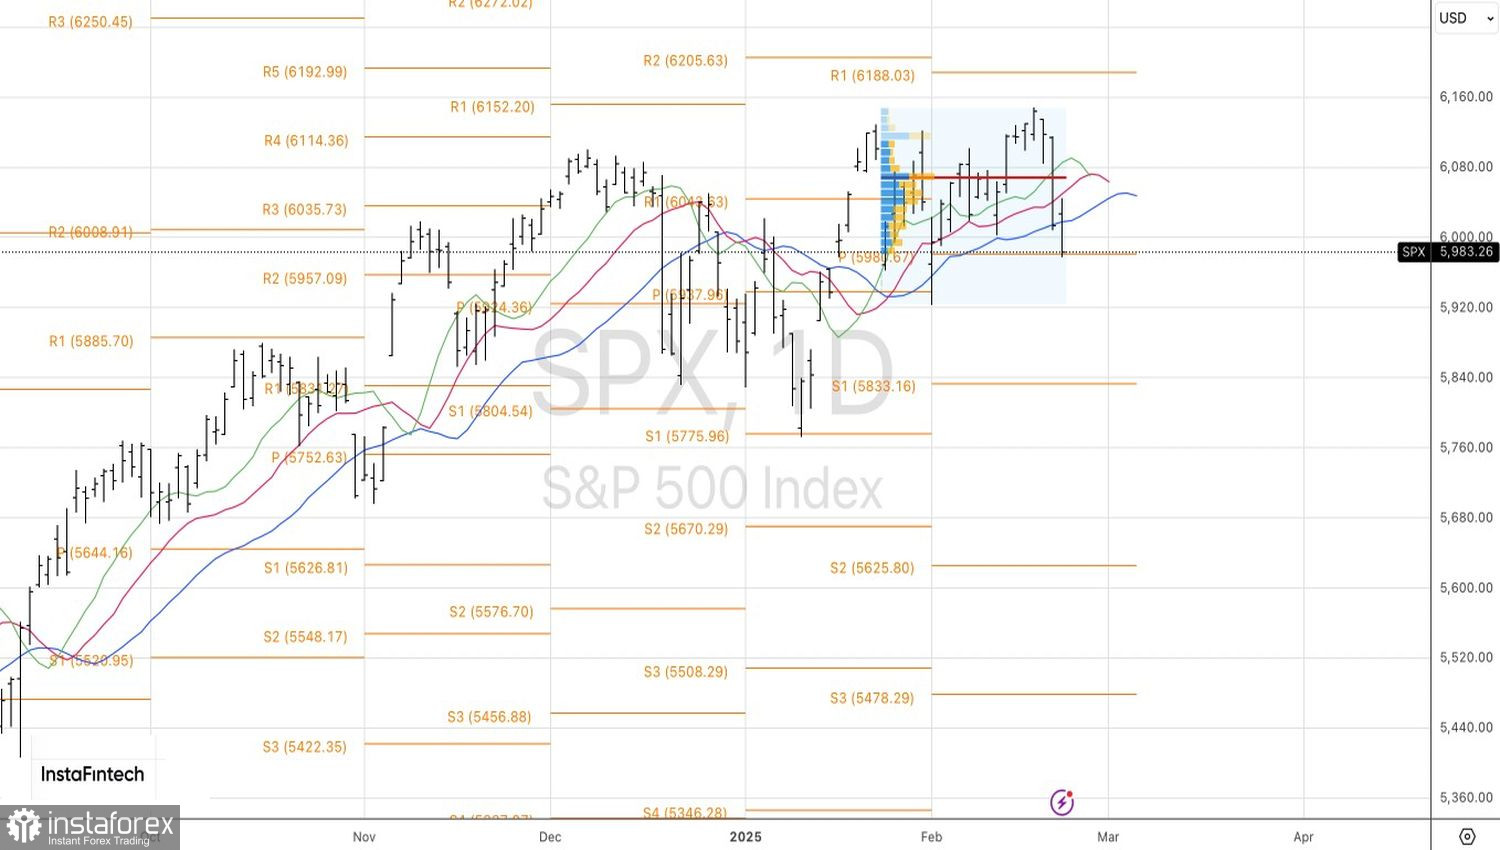
Technical outlook for S&P 500
On the daily chart, the S&P 500 continues to form an expanding wedge reversal pattern. For confirmation, the index needs to break below 5,925. Once this occurs, a short-term rebound is expected, providing an opportunity to increase short positions from 6,083.
*এখানে পোস্ট করা মার্কেট বিশ্লেষণ আপনার সচেতনতা বৃদ্ধির জন্য প্রদান করা হয়, ট্রেড করার নির্দেশনা প্রদানের জন্য প্রদান করা হয় না।
ইন্সটাফরেক্স বিশ্লেষণমূলক পর্যালোচনাগুলো আপনাকে মার্কেট প্রবণতা সম্পর্কে পুরোপুরি সচেতন করবে! ইন্সটাফরেক্সের একজন গ্রাহক হওয়ায়, দক্ষ ট্রেডিং এর জন্য আপনাকে অনেক সেবা বিনামূল্যে প্রদান করা হয়।


