


The legend in the InstaSpot team!
Legend! You think that's bombastic rhetoric? But how should we call a man, who became the first Asian to win the junior world chess championship at 18 and who became the first Indian Grandmaster at 19? That was the start of a hard path to the World Champion title for Viswanathan Anand, the man who became a part of history of chess forever. Now one more legend in the InstaSpot team!


Borussia is one of the most titled football clubs in Germany, which has repeatedly proved to fans: the spirit of competition and leadership will certainly lead to success. Trade in the same way that sports professionals play the game: confidently and actively. Keep a "pass" from Borussia FC and be in the lead with InstaSpot!

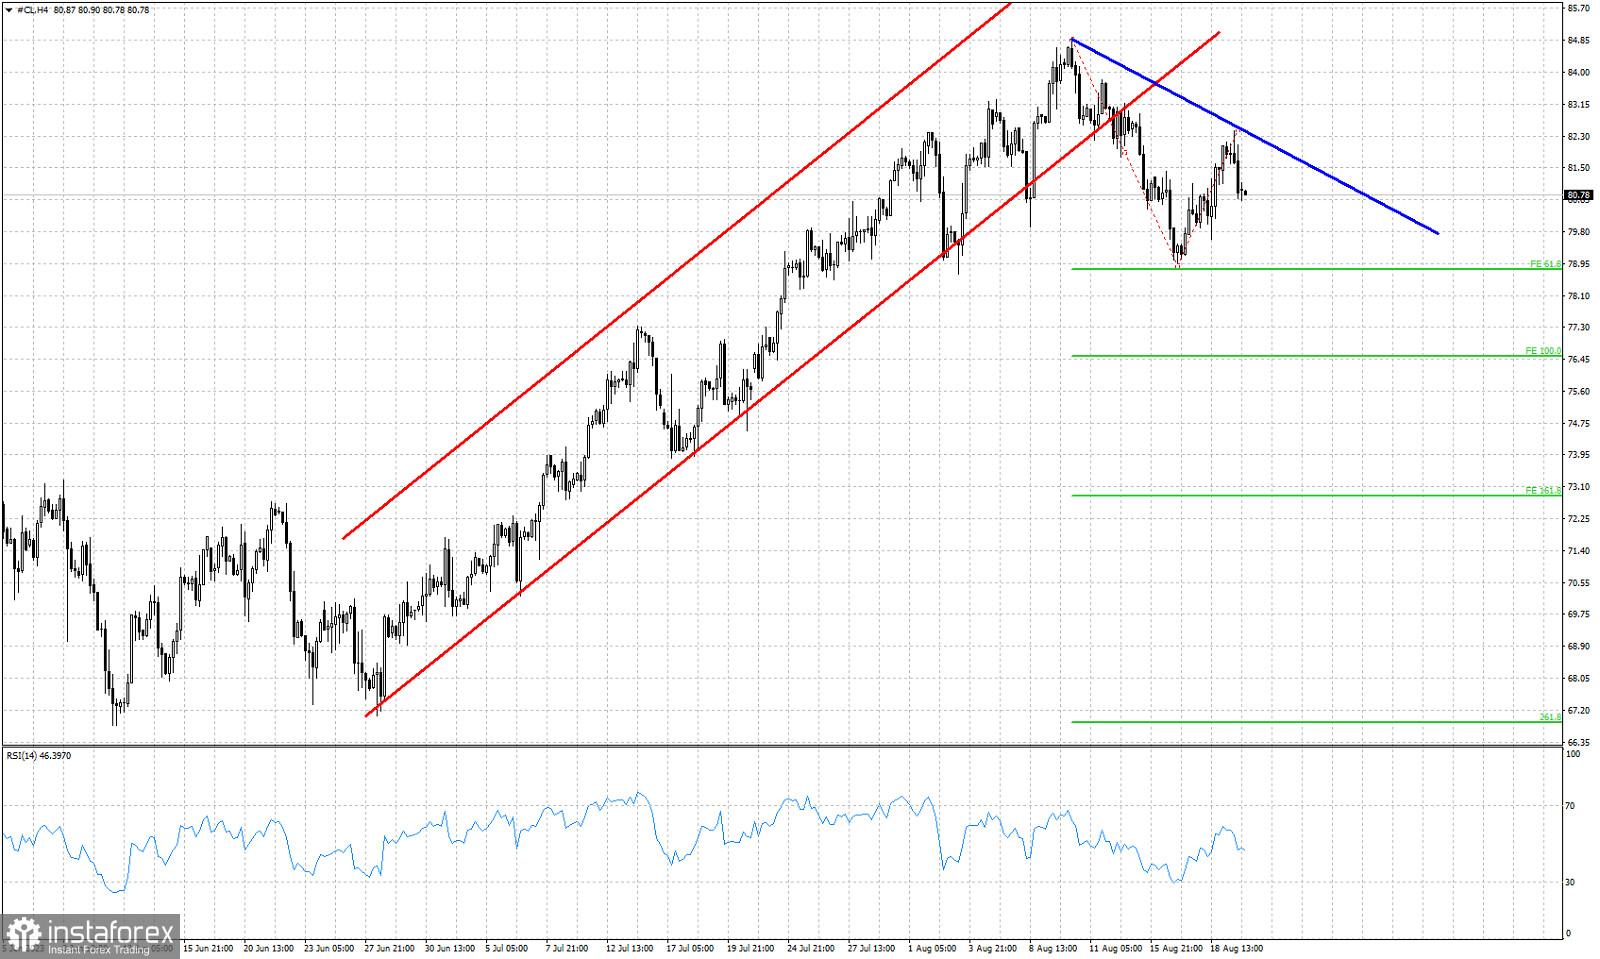
Red lines- bullish channel (broken)
Blue line- resistance trend line
Green lines- Fibonacci extension targets
Oil price is trading around $80.80. Recently price provided a bearish signal by breaking out and below the bullish channel it was in. Price fell towards $79 and then bounced towards $82.60 forming a lower high. As we mentioned in previous posts, our view is that Oil has completed the upward wave from $68 and is now in a correction phase. I believe the correction is not over at $79. This lower high if followed by a break below $79, will open the way for a move even lower towards $76.50 or even $73, These are the two downside targets by the Fibonacci extension tool, taking into consideration that price stays below the recent high of $82.60. The blue trend line is our resistance and we are short-term bearish as long as we trade below it.
*এখানে পোস্ট করা মার্কেট বিশ্লেষণ আপনার সচেতনতা বৃদ্ধির জন্য প্রদান করা হয়, ট্রেড করার নির্দেশনা প্রদানের জন্য প্রদান করা হয় না।
ইন্সটাফরেক্স বিশ্লেষণমূলক পর্যালোচনাগুলো আপনাকে মার্কেট প্রবণতা সম্পর্কে পুরোপুরি সচেতন করবে! ইন্সটাফরেক্সের একজন গ্রাহক হওয়ায়, দক্ষ ট্রেডিং এর জন্য আপনাকে অনেক সেবা বিনামূল্যে প্রদান করা হয়।


