


हमारी टीम के पास 7,000,000 से अधिक ट्रेडर हैं!
प्रतिदिन हम ट्रेडिंग को बेहतर बनाने के लिए एक साथ काम करते हैं। हम उच्च परिणाम प्राप्त कर रहे हैं और आगे की ओर बढ़ रहे हैं।
दुनियाभर के लाखों लोगों द्वारा हमारे काम को पहचानना, हमारे काम की सबसे अच्छी सराहना है! आपने आपनी पसंद बनाई है और हम आपकी अपेक्षाओं को पूरा करने के लिए हर संभव प्रयास करेंगे!
हम एक साथ एक अच्छी टीम हैं!
इंस्टाफॉरेक्स को इस बात का गर्व है कि वह आपके लिए काम कर रहा है!


एक्टर, यूएफसी 6 टूर्नामेंट का विजेता और एक सच्चा हीरो!
वह आदमी, जिसने अपनी मेहनत से सब किया है। वह आदमी, जो हमारे रास्तों पर चलता है.
टैक्टारोव की सफलता का राज लक्ष्य की ओर लगातर अग्रसर रहना है।
अपनी प्रतिभा के सभी पक्षों को प्रकट करें!
खोज करें, कोशिश करें, विफल हो-लेकिन कभी न रूकें!
इंस्टाफॉरेक्स- हमारी सफलताओं की कहानी यहाँ से शुरू होती है!

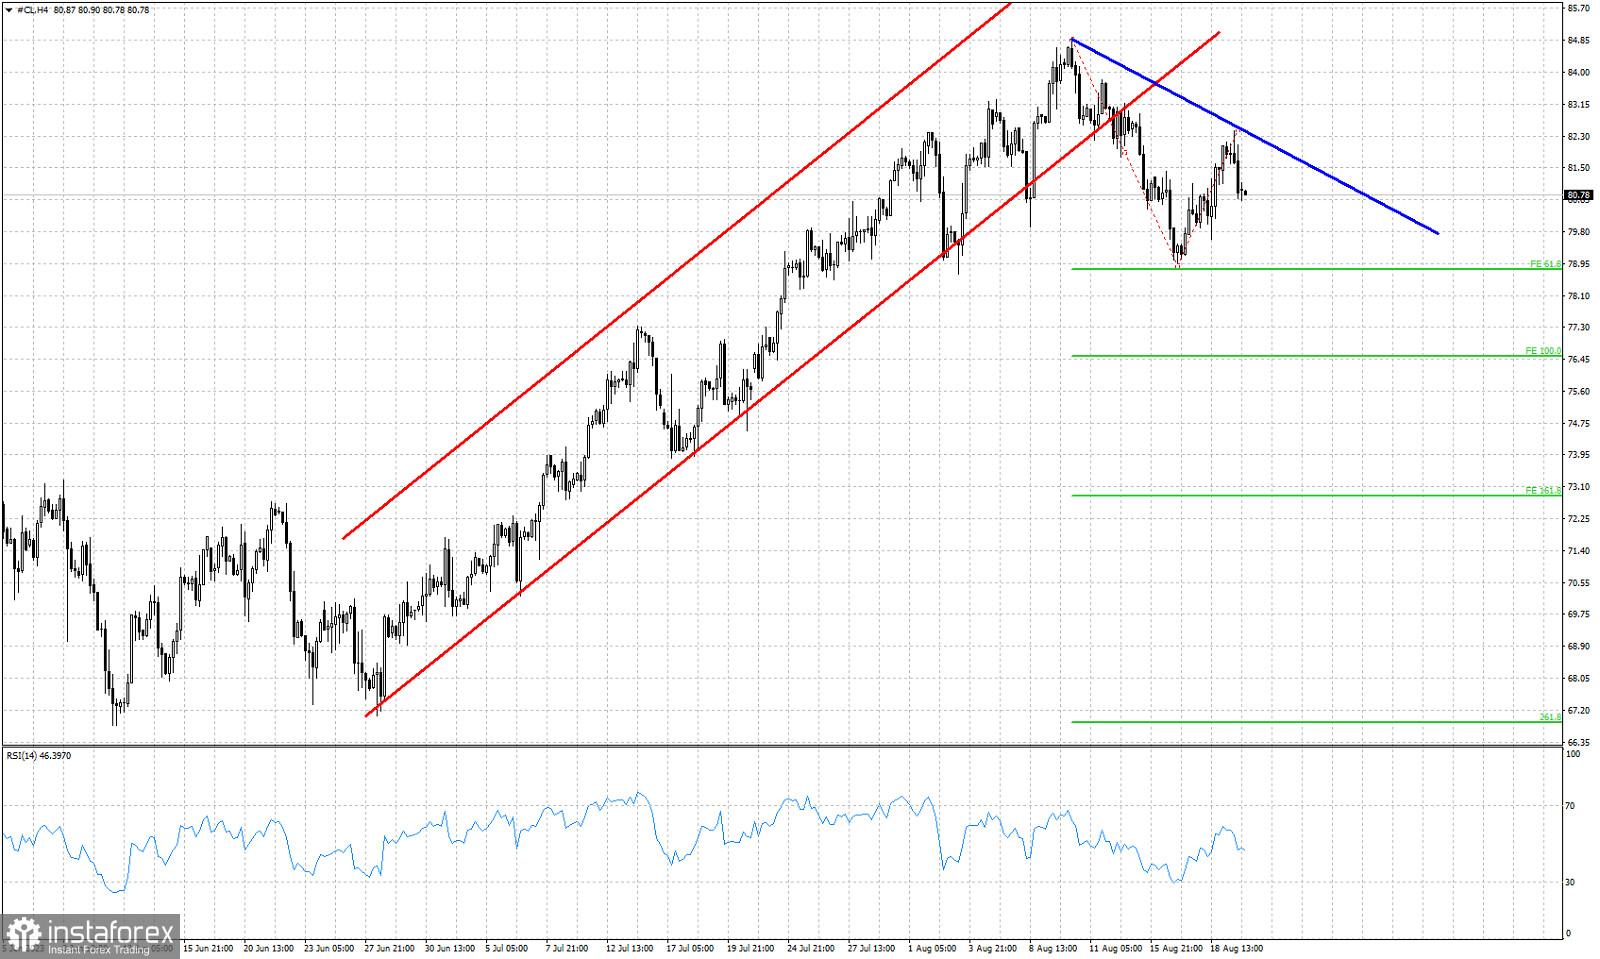
Red lines- bullish channel (broken)
Blue line- resistance trend line
Green lines- Fibonacci extension targets
Oil price is trading around $80.80. Recently price provided a bearish signal by breaking out and below the bullish channel it was in. Price fell towards $79 and then bounced towards $82.60 forming a lower high. As we mentioned in previous posts, our view is that Oil has completed the upward wave from $68 and is now in a correction phase. I believe the correction is not over at $79. This lower high if followed by a break below $79, will open the way for a move even lower towards $76.50 or even $73, These are the two downside targets by the Fibonacci extension tool, taking into consideration that price stays below the recent high of $82.60. The blue trend line is our resistance and we are short-term bearish as long as we trade below it.
*यहां पर लिखा गया बाजार विश्लेषण आपकी जागरूकता बढ़ाने के लिए किया है, लेकिन व्यापार करने के लिए निर्देश देने के लिए नहीं |
InstaSpot analytical reviews will make you fully aware of market trends! Being an InstaSpot client, you are provided with a large number of free services for efficient trading.


