


The legend in the InstaSpot team!
Legend! You think that's bombastic rhetoric? But how should we call a man, who became the first Asian to win the junior world chess championship at 18 and who became the first Indian Grandmaster at 19? That was the start of a hard path to the World Champion title for Viswanathan Anand, the man who became a part of history of chess forever. Now one more legend in the InstaSpot team!


Borussia is one of the most titled football clubs in Germany, which has repeatedly proved to fans: the spirit of competition and leadership will certainly lead to success. Trade in the same way that sports professionals play the game: confidently and actively. Keep a "pass" from Borussia FC and be in the lead with InstaSpot!

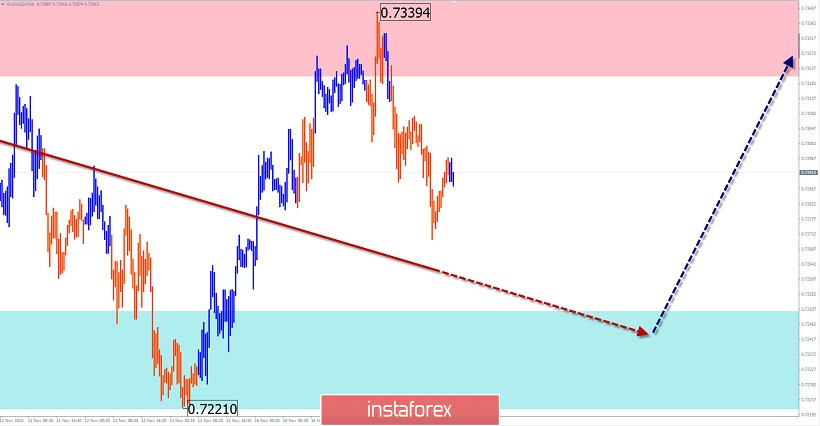
AUD/USD
Analysis:
The Incomplete section of the upward trend starts from September 25. The structure has a distinct wave zigzag. The price has reached the lower limit of strong resistance, from which a correction has been formed since November 9.
Forecast:
In the next 24 hours, the downward movement is expected to end, a reversal and a repeated price increase. If the exchange rate changes, a short-term puncture of the lower support border is not excluded.
Potential reversal zones
Resistance:
- 0.7320/0.7350
Support:
- 0.7250/0.7220
Recommendations:
Trading the Australian dollar today is possible within the intraday with a reduced lot. Sales are risky. In the support area, it is recommended to track signals for buying a pair.
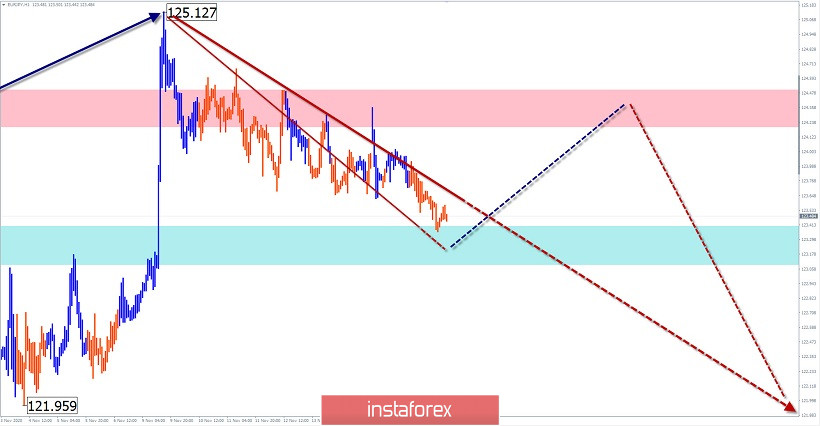
EUR/JPY
Analysis:
A descending wave structure has been developing on the pair's chart since the beginning of summer, correcting the previous momentum. The movement is not complete. The price decline that started on November 9 has a reversal potential and may be the beginning of the final part (C) of the main wave.
Forecast:
Today, the downward trend is expected to end and reverse. Then you can count on price growth, up to the boundaries of the resistance zone.
Potential reversal zones
Resistance:
- 124.20/124.50
Support:
- 123.40/123.10
Recommendations:
Trading today is only possible within the intra-session style, with a reduced lot. At the European session, purchases of the instrument are more promising. After the rise is completed and the sale signals appear, you should change the trading vector.
Explanation: In the simplified wave analysis (UVA), waves consist of 3 parts (A-B-C). The last incomplete wave is analyzed. The solid background of the arrows shows the formed structure, and the dotted background shows the expected movements.
Note: The wave algorithm does not take into account the duration of the instrument's movements in time!
*এখানে পোস্ট করা মার্কেট বিশ্লেষণ আপনার সচেতনতা বৃদ্ধির জন্য প্রদান করা হয়, ট্রেড করার নির্দেশনা প্রদানের জন্য প্রদান করা হয় না।
ইন্সটাফরেক্স বিশ্লেষণমূলক পর্যালোচনাগুলো আপনাকে মার্কেট প্রবণতা সম্পর্কে পুরোপুরি সচেতন করবে! ইন্সটাফরেক্সের একজন গ্রাহক হওয়ায়, দক্ষ ট্রেডিং এর জন্য আপনাকে অনেক সেবা বিনামূল্যে প্রদান করা হয়।


