


فريقنا لديه أكثر من 7,000,000 من التجار!
كل يوم نعمل معا لتحسين التداول. نحصل على نتائج عالية ونمضي قدما.
الاعتراف من قبل الملايين من التجار في جميع أنحاء العالم هو أفضل تقدير لعملنا! لقد قمت باختيارك وسنفعل كل ما يلزم لتلبية توقعاتك!
نحن فريق رائع معا!
إنستافوركس تعتز بالعمل بالنسبة لك!


الممثل وبطل مسابقة يو إف سي 6 وبطل حقيقي!
الرجل الذي حقق النجاح بعمله الدؤوب. الرجل الذي يذهب كما نريد.
سر نجاح تاكتاروف هو حركة مستمرة نحو الهدف.
اكشف عن جميع جوانب موهبتك!
اكتشف، وحاول، وافشل - ولكن لا تتوقف أبدا!
إنستافوركس. تبدأ قصة نجاحك من هنا!
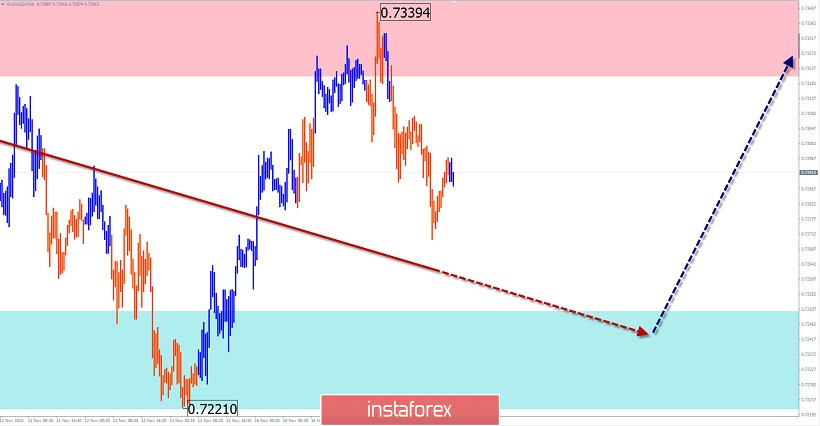
AUD/USD
Analysis:
The Incomplete section of the upward trend starts from September 25. The structure has a distinct wave zigzag. The price has reached the lower limit of strong resistance, from which a correction has been formed since November 9.
Forecast:
In the next 24 hours, the downward movement is expected to end, a reversal and a repeated price increase. If the exchange rate changes, a short-term puncture of the lower support border is not excluded.
Potential reversal zones
Resistance:
- 0.7320/0.7350
Support:
- 0.7250/0.7220
Recommendations:
Trading the Australian dollar today is possible within the intraday with a reduced lot. Sales are risky. In the support area, it is recommended to track signals for buying a pair.
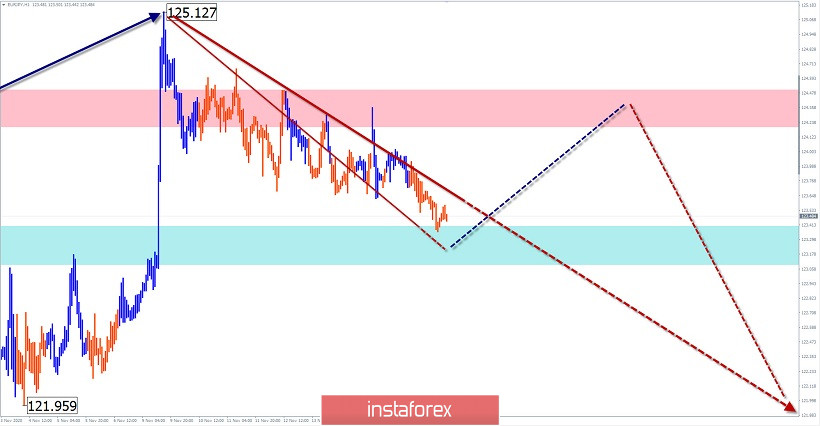
EUR/JPY
Analysis:
A descending wave structure has been developing on the pair's chart since the beginning of summer, correcting the previous momentum. The movement is not complete. The price decline that started on November 9 has a reversal potential and may be the beginning of the final part (C) of the main wave.
Forecast:
Today, the downward trend is expected to end and reverse. Then you can count on price growth, up to the boundaries of the resistance zone.
Potential reversal zones
Resistance:
- 124.20/124.50
Support:
- 123.40/123.10
Recommendations:
Trading today is only possible within the intra-session style, with a reduced lot. At the European session, purchases of the instrument are more promising. After the rise is completed and the sale signals appear, you should change the trading vector.
Explanation: In the simplified wave analysis (UVA), waves consist of 3 parts (A-B-C). The last incomplete wave is analyzed. The solid background of the arrows shows the formed structure, and the dotted background shows the expected movements.
Note: The wave algorithm does not take into account the duration of the instrument's movements in time!
*The market analysis posted here is meant to increase your awareness, but not to give instructions to make a trade.
InstaSpot analytical reviews will make you fully aware of market trends! Being an InstaSpot client, you are provided with a large number of free services for efficient trading.


