


Đội ngũ của chúng tôi có hơn 7,000,000 thương nhân!
Hàng ngày chúng tôi làm việc cùng nhau để cải thiện việc giao dịch. Chúng tôi nhận được kết quả cao và luôn tiến lên phía trước.
Sự công nhận của hàng triệu thương nhân trên toàn thế giới là sự đánh giá tốt nhất cho công việc của chúng tôi! Bạn đã đưa ra quyết định của mình và chúng tôi sẽ làm mọi thứ cần thiết để đáp ứng mong đợi của bạn!
Chúng ta cùng với nhau sẽ là một nhóm tuyệt vời!
InstaSpot. Tự hào làm việc cho bạn!


Diễn viên, nhà vô địch mùa giải UFC 6 và là người hùng thật sự!
Người tự mình làm nên tất cả. Người đàn ông đáng kể học hỏi.
Bí mật đằng sau thành công của Taktarov là sự cố gắng liên tục hướng tới mục tiêu.
Hãy khai phá tất cả các mặt tài năng của bạn!
Khám phá, thử, thất bại - nhưng không bao giờ dừng lại!
InstaSpot. Câu chuyện thành công của bạn bắt đầu từ đây!
The economic calendar lacked high-impact data on Friday.
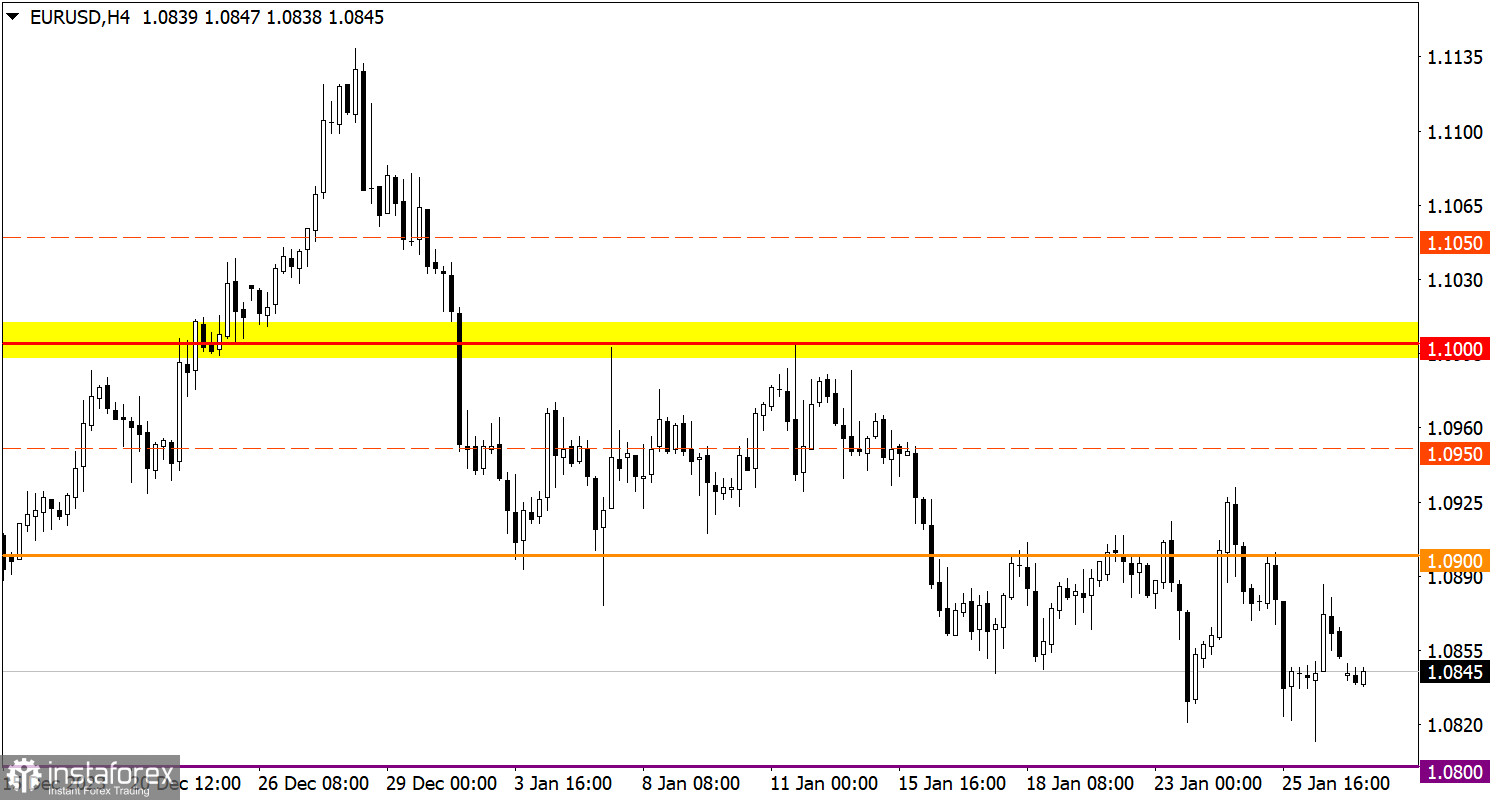
EUR/USD reached the bottom of the correction cycle accompanied by pronounced speculative activity.
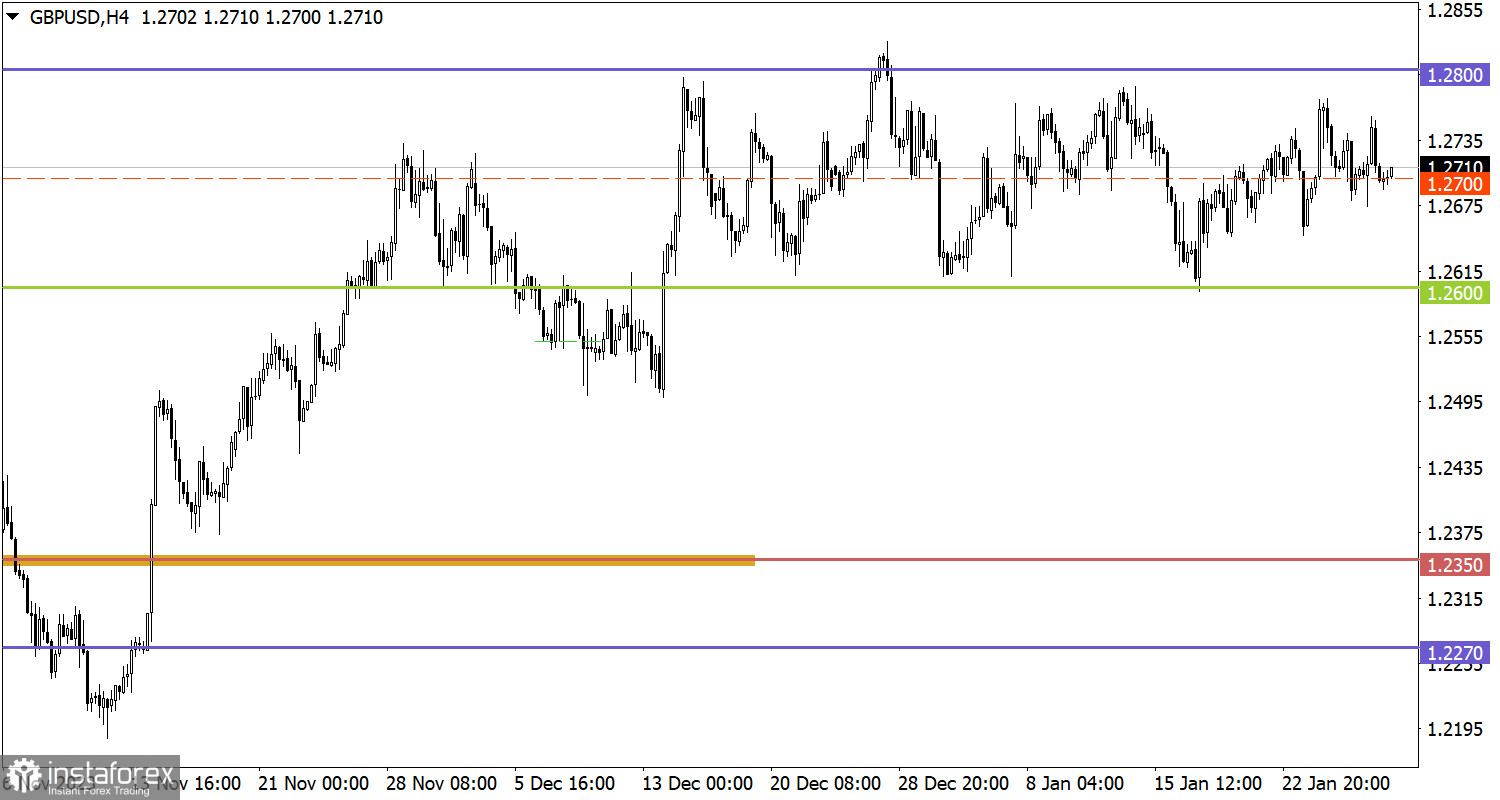
The GBP/USD pair had been trapped within the sideways channel between 1.2600 and 1.2800 for the seventh week in a row. There is periodic speculative activity, but special attention is paid to the middle level of the sideways channel at 1.2700.

Traditionally, the new trading week begins with the empty economic calendar. This is common for Monday. Nevertheless, this week is going to be jam-packed with major events. Two central banks are holding policy meetings. As for macroeconomic data, the market will get to know inflation data for the EU and the US nonfarm payrolls for January.
The extension of the downward correction indicates the overall bearish interest among market participants. However, as before, the level of 1.0800 serves as an obstacle for the sellers, which, according to technical analysis, can put pressure on short positions. Thus, the downward cycle is limited to this level, which means some uncertainty in market sentiment. If the price settles below 1.0800 during the day, traders may add short positions.
The median level acts as an indicator of trading interest within the sideways channel. Price stabilization below this level may be followed by a movement towards the lower border of 1.2600. However, all price fluctuations so far fit within the current corridor, which, is still in the making according to technical analysis. A priority strategy among market participants is trading during a breakout of one of the borders of the sideways channel.
The candlestick chart type consists of graphic rectangles in white and black with lines at the top and bottom. With a detailed analysis of each individual candle, you can see its characteristics relative to a particular time period: opening price, closing price, maximum and minimum price.
Horizontal levels are price coordinates relative to which a price may stop or revered its trajectory. In the market, these levels are called support and resistance.
Circles and rectangles are highlighted examples where the price developed. This color highlighting indicates horizontal lines that may put pressure on the price in the future.
Up/down arrows are guidelines for a possible direction in the future.
*Phân tích thị trường được đăng tải ở đây có nghĩa là để gia tăng nhận thức của bạn, nhưng không đưa ra các chỉ dẫn để thực hiện một giao dịch.
InstaSpot analytical reviews will make you fully aware of market trends! Being an InstaSpot client, you are provided with a large number of free services for efficient trading.


