


الأسطورة فى فريق إنستافوركس!
الأسطورة! هل تعتقد أن هذا هو الخطاب المنمق؟ ولكن كيف ينبغي أن نطلق على الرجل، الذي أصبح أول آسيوي يفوز ببطولة العالم للشطرنج للشباب بعمر 18 سنة والذي أصبح أول أستاذ كبير هندي في سن 19؟ وكانت هذه بداية طريق صعب إلى لقب بطل العالم لـ فيسواناثان أناند، الرجل الذي أصبح جزءًا من تاريخ الشطرنج إلى الأبد. والآن أسطورة آخر في فريق إنستافوركس!


يعتبر بوروسيا دورتموند أحد أكثر أندية كرة القدم حصولاً على الألقاب في ألمانيا، وقد أثبت ذلك مرارًا وتكرارًا للجماهير: فإنّ روح المنافسة والقيادة ستؤدي بالتأكيد إلى النجاح. قم بالتداول بنفس الطريقة التي يلعب بها المحترفون الرياضيون اللعبة: بثقة ونشاط. احتفظ بـ "ترخيص دخول" من نادي بوروسيا دورتموند لكرة القدم وكن في الصدارة مع إنستافوركس!
The economic calendar lacked high-impact data on Friday.
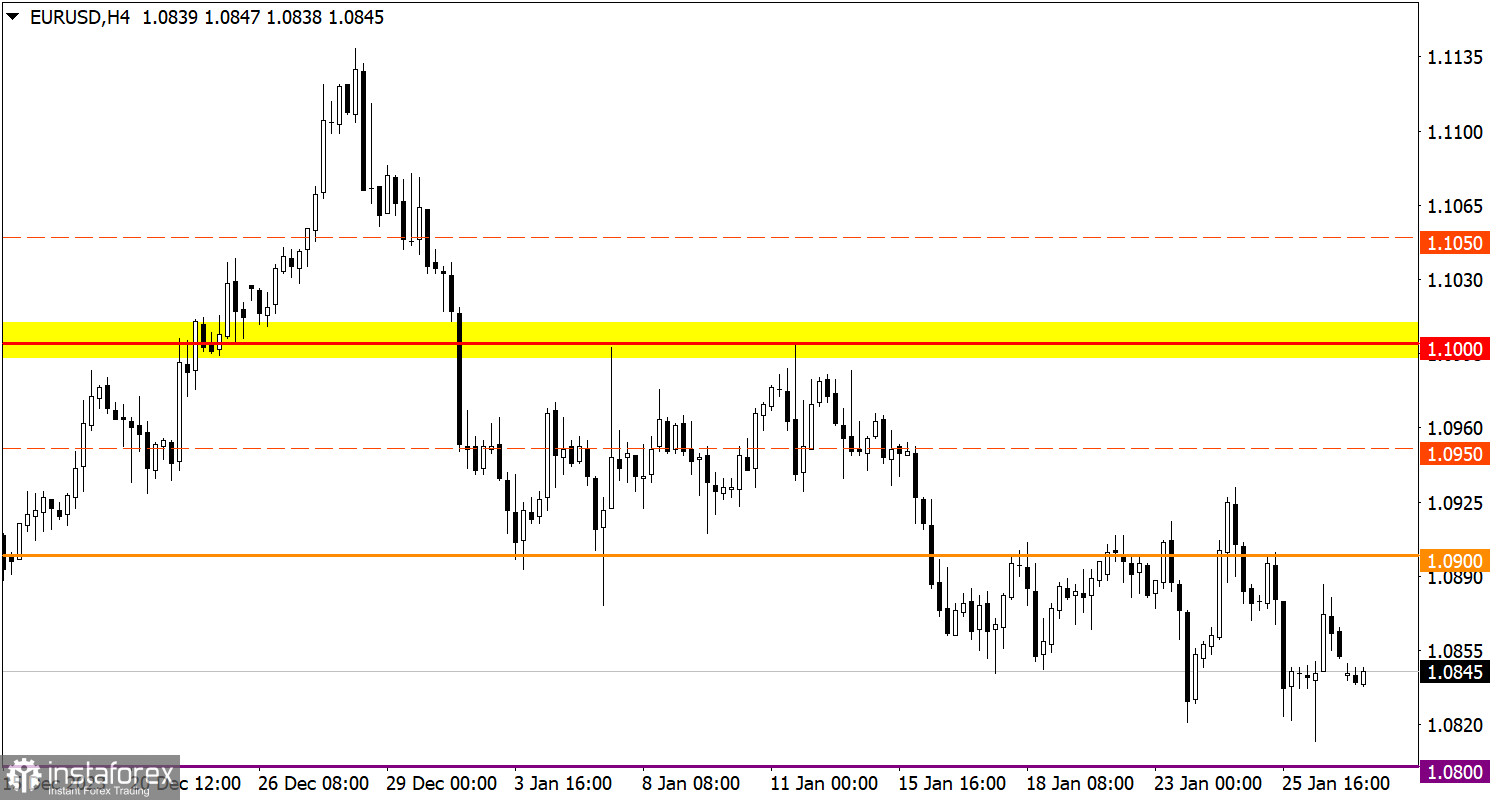
EUR/USD reached the bottom of the correction cycle accompanied by pronounced speculative activity.
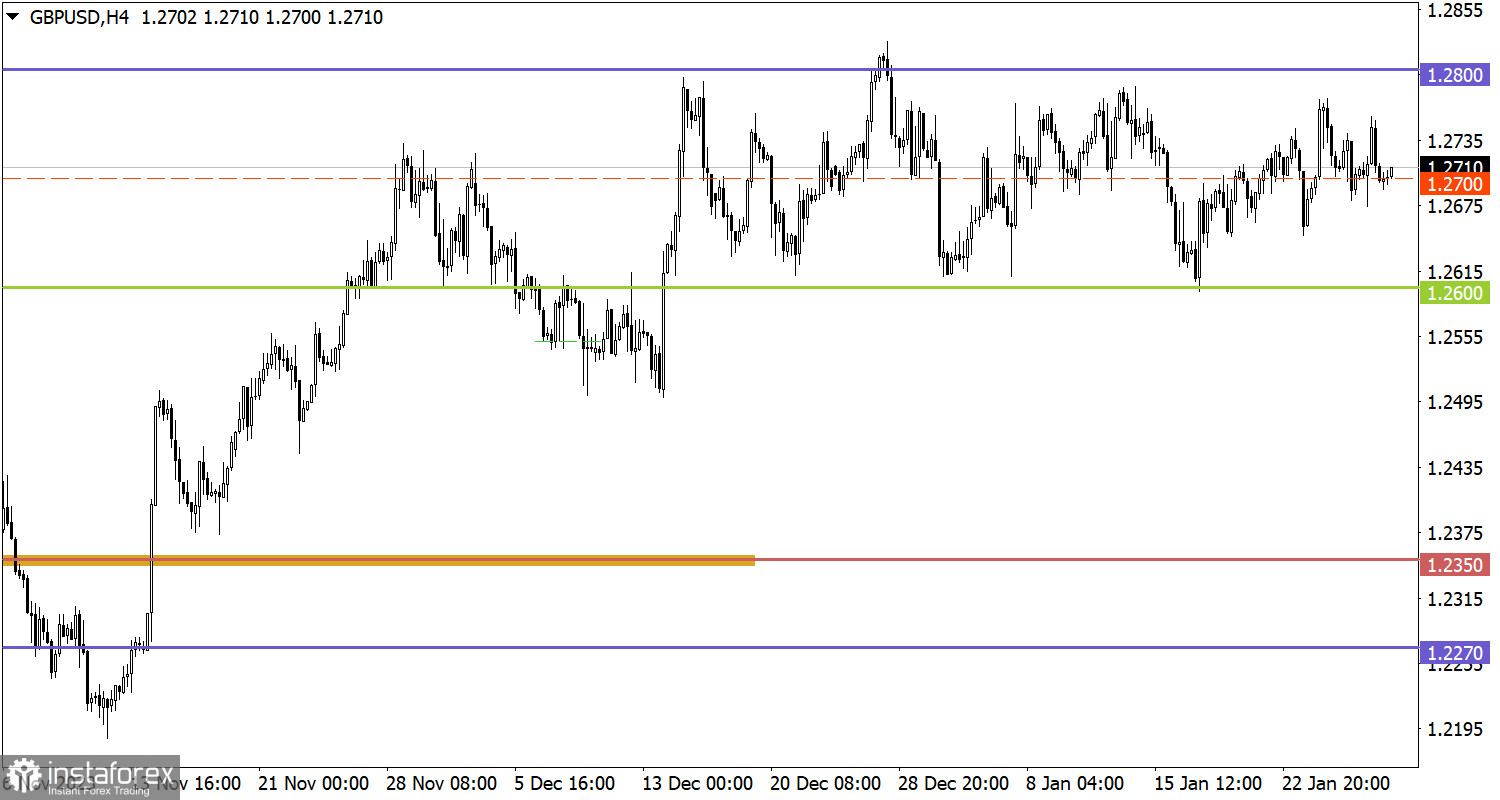
The GBP/USD pair had been trapped within the sideways channel between 1.2600 and 1.2800 for the seventh week in a row. There is periodic speculative activity, but special attention is paid to the middle level of the sideways channel at 1.2700.

Traditionally, the new trading week begins with the empty economic calendar. This is common for Monday. Nevertheless, this week is going to be jam-packed with major events. Two central banks are holding policy meetings. As for macroeconomic data, the market will get to know inflation data for the EU and the US nonfarm payrolls for January.
The extension of the downward correction indicates the overall bearish interest among market participants. However, as before, the level of 1.0800 serves as an obstacle for the sellers, which, according to technical analysis, can put pressure on short positions. Thus, the downward cycle is limited to this level, which means some uncertainty in market sentiment. If the price settles below 1.0800 during the day, traders may add short positions.
The median level acts as an indicator of trading interest within the sideways channel. Price stabilization below this level may be followed by a movement towards the lower border of 1.2600. However, all price fluctuations so far fit within the current corridor, which, is still in the making according to technical analysis. A priority strategy among market participants is trading during a breakout of one of the borders of the sideways channel.
The candlestick chart type consists of graphic rectangles in white and black with lines at the top and bottom. With a detailed analysis of each individual candle, you can see its characteristics relative to a particular time period: opening price, closing price, maximum and minimum price.
Horizontal levels are price coordinates relative to which a price may stop or revered its trajectory. In the market, these levels are called support and resistance.
Circles and rectangles are highlighted examples where the price developed. This color highlighting indicates horizontal lines that may put pressure on the price in the future.
Up/down arrows are guidelines for a possible direction in the future.
*The market analysis posted here is meant to increase your awareness, but not to give instructions to make a trade.
InstaSpot analytical reviews will make you fully aware of market trends! Being an InstaSpot client, you are provided with a large number of free services for efficient trading.


