


ตำนานแห่งทีม InstaSpot!
ที่สุด! คุณคิดว่าอะไรคือการทำให้รู้สึกฮึกเหิมกันละ? แต่พวกเราควรจะเรียกคนที่กลายมาเป็นชาวเอเชียคนแรกที่คว้าแชมป์หมากรุกระดับโลกรุ่นเยาวชนอายุ 18 ปี และยังกลายมาเป็นแกรนด์มาสเตอร์ชาวอินเดียคนแรกด้วยอายุ 19ปีเท่านั้น? นั้นเป็นจุดเริ่มต้นของเส้นทางสู่การเป็นแชมป์โลกสำหรับคุณ Viswanathan Anand คนที่กลายมาเป็นส่วนหนึ่งในหน้าประวติศาสตร์หมากรุกไปตลาดกาล ตอนนี้ก็มีอีกตำนานมาอยู่ในทีม InstaSpot แล้ว!


Borussia เป็นหนึ่งในสโมสรฟุตบอลขึ้นชื่อในประเทศเยอรมนี ที่ได้พิสูจน์ให้กับเหล่าแฟนๆเห็นแล้วถึงจิตวิญญาณของการแข่งขัน และการขึ้นมาสู่จุดสูงสุด เพื่อจะมุ่งหน้าสู่ความสำเร็จ การเทรดเองก็เหมือนกับการเล่นกีฬาอย่างมืออาชีพในการแข่งขัน โดยต้องมีความมั่นใจและการไม่หยุดนิ่ง เพื่อที่จะได้ "ผ่าน" จากสโมสร Borussia FC และขึ้นมาอยู่ในอันดับต้นไปพร้อมกับ InstaSpot!

Bitcoin and Ethereum are finally showing signs of completing a three-month upward correction. There are liquidity pools below, where the price is likely to drop with a 90% probability. Structural breaks are forming, sell signals are emerging, and "bearish" patterns are developing. Thus, as before, we are set on the decline of the two main cryptocurrencies.
Meanwhile, the analytical company Coinglass reported a wave of liquidations of leveraged futures positions amounting to $600 million, which triggered Bitcoin's drop below $77,000. It is worth reminding that many experts had previously warned about the futures and speculative nature of the rise of the first cryptocurrency in recent months. We also warned that such trades are short-term in nature and therefore cannot become the foundation for an upward trend. The first wave of liquidations saw Bitcoin plunge, pulling the entire cryptocurrency market along with it through the dominance index, which remains high. There was also a recorded outflow of capital from Bitcoin ETFs and funds associated with Ark Invest. Despite Cathie Wood's promises that Bitcoin prices will reach outrageous levels in just a few years, investors are not currently placing much trust in these forecasts. Spot demand remains quite weak.
At the same time, it is noted that long-term investors continue to accumulate "digital gold," which may lead to a sustainable upward trend in the future. Strategy bought several thousand more Bitcoin coins, which, as we can see, does not save the first cryptocurrency from falling. Nor does the easing of tensions surrounding the conflict in the Middle East. We still believe that the bearish trend is not complete. Typically, it lasts at least one year, during which Bitcoin in such trends loses 70-80% of its value.
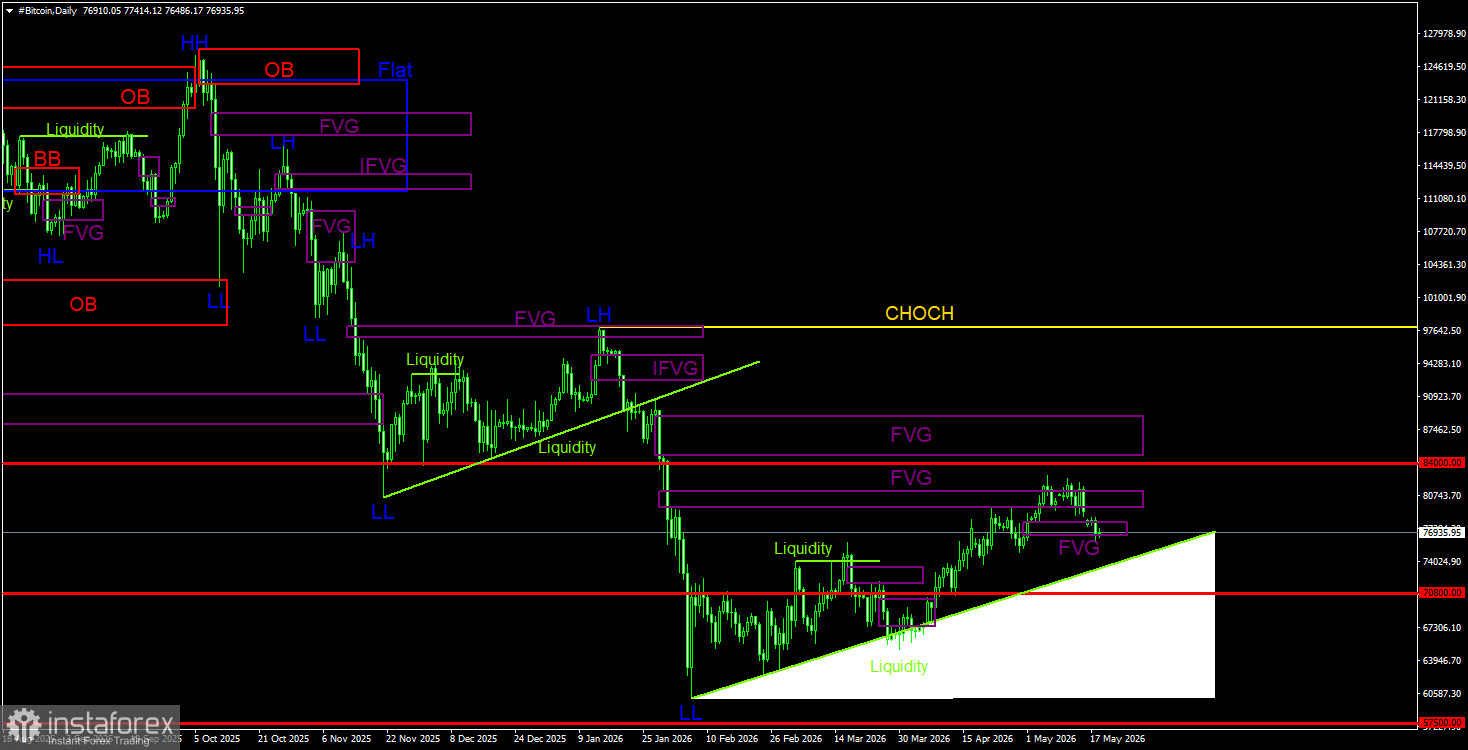
Bitcoin continues to form a full-fledged downward trend and a correction against it. We continue to expect a decline, targeting $57,500 (the 61.8% Fibonacci level of the three-year upward trend), and there are still no signs of a long-term upward trend. Among the POI areas, only the nearest bearish FVG on the daily timeframe is noted, located in the range of $79,300 - $81,200. A sell signal formed in this area (on the second attempt) and was confirmed on the hourly timeframe. Thus, in the near future, we are set for a resumption of the downward trend, and the bearish patterns on the 4-hour timeframe can be used to open short positions for those who have not yet done so.
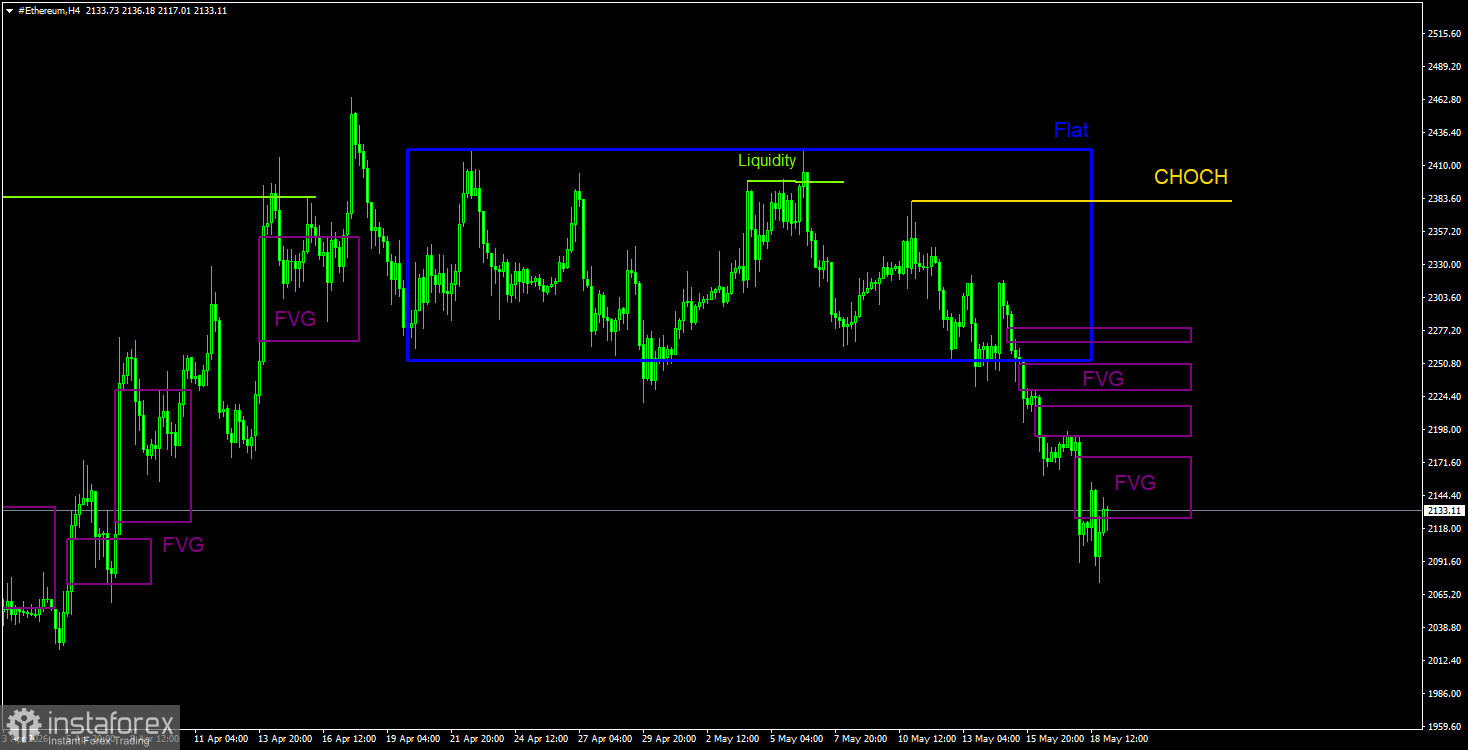
On the daily timeframe, a downward trend and correction against it continue to form. The key sell pattern has been and remains a bearish Order block on the weekly timeframe. As we warned, the movement provoked by this signal could be strong and prolonged. We do not believe it is finished, as there are no signs of completion of the downward trend for either Bitcoin or Ethereum. In the near term, Ethereum may continue to decline, as more signs of the end of the three-month correction are emerging for both Ethereum and Bitcoin. On the 4-hour timeframe, the trend is downward, so bearish patterns can be used to open short positions. The target remains at the level of $1,742.
CHOCH – break in the trend structure.
Liquidity – Stop Loss, pending orders that market makers use to build their positions.
FVG – Area of price inefficiency. The price passes through such areas very quickly, indicating a complete absence of one side in the market. Subsequently, the price tends to return and receives a reaction from such areas in continuation of the main trend.
IFVG – Inverted area of price inefficiency. After returning to such an area, the price does not receive a reaction from it but impulsively breaks through and then tests from the other side.
OB – Order block. The candle on which the market maker opened a position with the goal of acquiring liquidity to form their own position in the opposite direction.
*บทวิเคราะห์ในตลาดที่มีการโพสต์ตรงนี้ เพียงเพื่อทำให้คุณทราบถึงข้อมูล ไม่ได้เป็นการเจาะจงถึงขั้นตอนให้คุณทำการซื้อขายตาม
บทวิเคราะห์ของทาง InstaSpot จะทำให้คุณทราบถึงแนวโน้มของตลาด! ในการที่เป็นลูกค้าของทาง InstaSpot นั้นคุณจะได้รับการบริการเพื่อการซื้อขายอย่างเต็มประสิทธิภาพอย่างมากมาย


