


ตำนานแห่งทีม InstaSpot!
ที่สุด! คุณคิดว่าอะไรคือการทำให้รู้สึกฮึกเหิมกันละ? แต่พวกเราควรจะเรียกคนที่กลายมาเป็นชาวเอเชียคนแรกที่คว้าแชมป์หมากรุกระดับโลกรุ่นเยาวชนอายุ 18 ปี และยังกลายมาเป็นแกรนด์มาสเตอร์ชาวอินเดียคนแรกด้วยอายุ 19ปีเท่านั้น? นั้นเป็นจุดเริ่มต้นของเส้นทางสู่การเป็นแชมป์โลกสำหรับคุณ Viswanathan Anand คนที่กลายมาเป็นส่วนหนึ่งในหน้าประวติศาสตร์หมากรุกไปตลาดกาล ตอนนี้ก็มีอีกตำนานมาอยู่ในทีม InstaSpot แล้ว!


Borussia เป็นหนึ่งในสโมสรฟุตบอลขึ้นชื่อในประเทศเยอรมนี ที่ได้พิสูจน์ให้กับเหล่าแฟนๆเห็นแล้วถึงจิตวิญญาณของการแข่งขัน และการขึ้นมาสู่จุดสูงสุด เพื่อจะมุ่งหน้าสู่ความสำเร็จ การเทรดเองก็เหมือนกับการเล่นกีฬาอย่างมืออาชีพในการแข่งขัน โดยต้องมีความมั่นใจและการไม่หยุดนิ่ง เพื่อที่จะได้ "ผ่าน" จากสโมสร Borussia FC และขึ้นมาอยู่ในอันดับต้นไปพร้อมกับ InstaSpot!

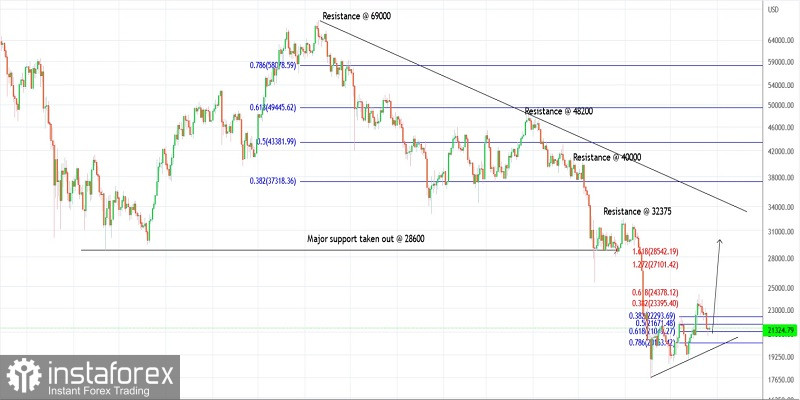
Bitcoin dropped towards the $20,700 lows on Tuesday before finding support and pulling back higher. The crypto is seen to be trading close to $21,300 at this point in writing and is expected to resume its rally towards $29,000 in the next few weeks. Bulls are looking poised to hold prices above the $18,800 interim support to keep the near-term structure intact.
Bitcoin has been unfolding a counter-trend rally since June 19, 2022, after printing lows at around $17,500. The pattern seems to be unfolding as a flat or a combination and might terminate at about $29,000. If the proposed structure is correct, the bulls will remain poised to be back in control from here on.
Bitcoin has been dropping since November 2021 after hitting all-time highs close to $69,000. The drop between $69,000 and $17,500 seems to consist of three waves, hence it looks corrective so far. If prices do not break above the $48,000 resistance in the next leg higher, the bears will be inclined to come back in control and drag the price below the $17,500 interim support.
Going forward:
Bitcoin has retraced its recent upswing between $18,800 and $24,200 dropping through $20,700. Please note that it is close to the Fibonacci 0.618 retracement of the above upswing. Hence, a strong possibility remains for a bullish reversal. Also, note that a Doji candlestick pattern was produced on the daily chart, which could be the potential turning point.
Potential rally towards $29,000 against $18,500
Good luck!
*บทวิเคราะห์ในตลาดที่มีการโพสต์ตรงนี้ เพียงเพื่อทำให้คุณทราบถึงข้อมูล ไม่ได้เป็นการเจาะจงถึงขั้นตอนให้คุณทำการซื้อขายตาม
บทวิเคราะห์ของทาง InstaSpot จะทำให้คุณทราบถึงแนวโน้มของตลาด! ในการที่เป็นลูกค้าของทาง InstaSpot นั้นคุณจะได้รับการบริการเพื่อการซื้อขายอย่างเต็มประสิทธิภาพอย่างมากมาย


