


Нашият екип има над 7 000 000 търговци!
Всеки ден работим заедно, за да подобрим търговията. Получаваме високи резултати и напредваме.
Признанието от милионите търговци по целия свят е най-доброто признание за нашата работа! Направихте своя избор и ние ще направим всичко, което е необходимо, за да отговорим на вашите очаквания!
Ние сме един страхотен екип заедно!
ИнстаФорекс. Горд съм да работя за вас!


Актьор, шампион на UFC 6 турнира и истински герой!
Човекът, който изгради себе си. Човекът, който върви по пътя ни.
Тайната зад успеха на Тактаров е постоянно движение към целта.
Открийте всички страни на вашия талант!
Откривайте, опитвайте, проваляйте се - но никога не спирайте!
ИнстаФорекс. Вашата успешна история започва тук!

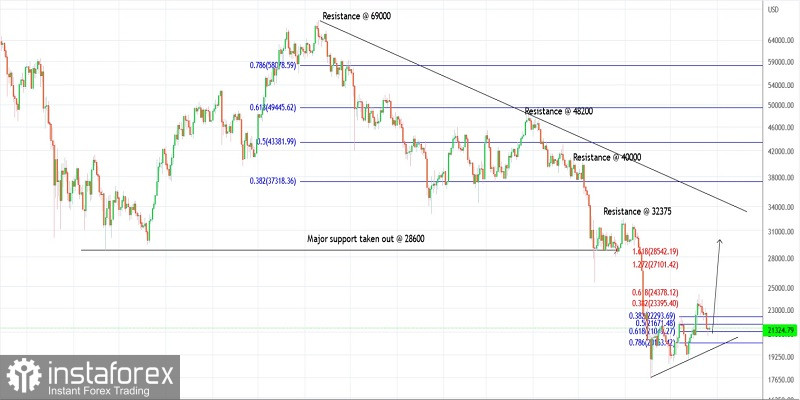
Bitcoin dropped towards the $20,700 lows on Tuesday before finding support and pulling back higher. The crypto is seen to be trading close to $21,300 at this point in writing and is expected to resume its rally towards $29,000 in the next few weeks. Bulls are looking poised to hold prices above the $18,800 interim support to keep the near-term structure intact.
Bitcoin has been unfolding a counter-trend rally since June 19, 2022, after printing lows at around $17,500. The pattern seems to be unfolding as a flat or a combination and might terminate at about $29,000. If the proposed structure is correct, the bulls will remain poised to be back in control from here on.
Bitcoin has been dropping since November 2021 after hitting all-time highs close to $69,000. The drop between $69,000 and $17,500 seems to consist of three waves, hence it looks corrective so far. If prices do not break above the $48,000 resistance in the next leg higher, the bears will be inclined to come back in control and drag the price below the $17,500 interim support.
Going forward:
Bitcoin has retraced its recent upswing between $18,800 and $24,200 dropping through $20,700. Please note that it is close to the Fibonacci 0.618 retracement of the above upswing. Hence, a strong possibility remains for a bullish reversal. Also, note that a Doji candlestick pattern was produced on the daily chart, which could be the potential turning point.
Potential rally towards $29,000 against $18,500
Good luck!
*Анализът на пазара публикуван тук има за цел да повиши информираността Ви, но не и да дава указания за търговия.
Аналитичните прегледи на ИнстаФорекс ще ви запознаят изцяло с пазарните тенденции! Като клиент на ИнстаФорекс, на вас се предоставят голям брой безплатни услуги за ефикасна търговия.


