


ทีมงานของพวกเรา พร้อมกับเทรดเดอร์มากกว่า 7,000,000 คน!
ในทุกวัน พวกเราได้รวมงานร่วมกันเพื่อพัฒนาการเทรด พวกเรามีผลตอบรับที่ดี และยังเดินหน้าต่อไป
การยอมรับจากเทรดเดอร์นับล้านจากทั่วทุกมุมโลกนั้นเป็น ผลงา่นอันน่าประทับใจมากที่สุดของพวกเรา! คุณเลือกตัวเลือก และพวกเราจะจัดการทุกอย่างให้ตรงกับการคาดหวังของคุณ !
พวกเราเป็นทีมงานที่ดีที่สุด!
InstaSpot รู้สึกเป็นเกียรติที่ได้ร่วมงานกับคุณ !


นักแสดง, แชมป์เปี้ยนทัวร์นาเม้น UFC 6 และฮิโรที่แท้จริง !
ชายผู้สามารถก่อร่างสร้างตัวขึ้นมาได้ด้วยตัวเขาเอง ชายผู้ที่นำพาเส้นทางให้พวกเรา
ความลับที่อยู่เบื้องหลังความสำเร็จของ Taktarov ก็คือการมุ่งหน้าไปสู่เป้าหมายแบบทันที
เปิดเผยทุกด้านของความสำเร็จคุณ !
ค้นพบ, พยายาม, ผิดพลาดได้ แต่อย่าพึ่งหยุดยั่ง !
InstaSpot ที่พร้อมจะเป็นจุดเริ่มต้น เรื่องราวความสำเร็จของคุณ !

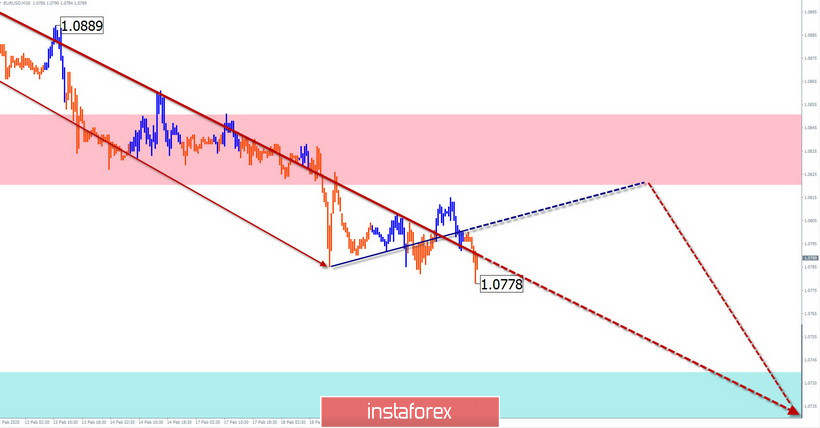
EUR/USD
Analysis:
The downward wave continues to move the quotes of the euro to the bottom of the chart. The last trend section started at the beginning of this year. By now, the movement has entered its final phase.
Forecast:
In the structure of the descending wave, all the conditions are met for a further breakthrough in the euro exchange rate. In the first half of the day, the yen is likely to move sideways and not above the resistance zone. The active phase of the decline can be expected by the end of the day.
Potential reversal zones
Resistance:
- 1.0820/1.0850
Support:
- 1.0740/1.0710
Recommendations:
It is possible to make trade deals on the euro market today only in the direction of the main trend. It is recommended that you monitor all emerging instrument sales signals.
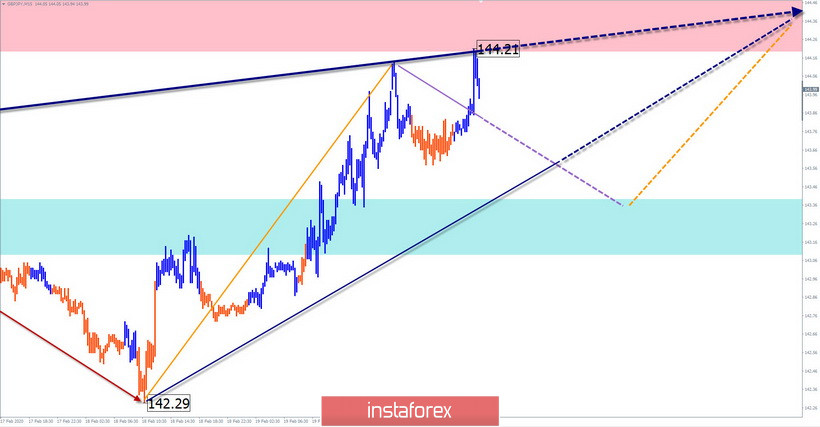
GBP/JPY
Analysis:
Price fluctuations of the short-term trend of the pair are set by the descending wave algorithm from December 13. Since the beginning of January, quotes have been forming a complex correction wave that resembles a stretched plane in its shape. The movement has entered its final phase. The price is close to the lower border of a strong potential reversal zone.
Forecast:
A breakthrough of a strong counter zone up is unlikely without a preliminary pullback down. Today, the general flat mood of the movement is expected. In the next session, you can expect an attempt to pressure the resistance zone. At the end of the day, the price is likely to move down.
Potential reversal zones
Resistance:
- 144.20/144.50
Support:
- 143.40/143.10
Recommendations:
Today, short-term sales with a reduced lot are possible on the pair's market. In the area of the support zone, it is recommended to end the trade and look for signals to buy the pair.
Explanations: In the simplified wave analysis (UVA), waves consist of 3 parts (A-B-C). The last incomplete wave is analyzed. The solid background of the arrows shows the formed structure and the dotted background shows the expected movements.
Note: The wave algorithm does not take into account the duration of the tool's movements in time!
*บทวิเคราะห์ในตลาดที่มีการโพสต์ตรงนี้ เพียงเพื่อทำให้คุณทราบถึงข้อมูล ไม่ได้เป็นการเจาะจงถึงขั้นตอนให้คุณทำการซื้อขายตาม
บทวิเคราะห์ของทาง InstaSpot จะทำให้คุณทราบถึงแนวโน้มของตลาด! ในการที่เป็นลูกค้าของทาง InstaSpot นั้นคุณจะได้รับการบริการเพื่อการซื้อขายอย่างเต็มประสิทธิภาพอย่างมากมาย


