


ตำนานแห่งทีม InstaSpot!
ที่สุด! คุณคิดว่าอะไรคือการทำให้รู้สึกฮึกเหิมกันละ? แต่พวกเราควรจะเรียกคนที่กลายมาเป็นชาวเอเชียคนแรกที่คว้าแชมป์หมากรุกระดับโลกรุ่นเยาวชนอายุ 18 ปี และยังกลายมาเป็นแกรนด์มาสเตอร์ชาวอินเดียคนแรกด้วยอายุ 19ปีเท่านั้น? นั้นเป็นจุดเริ่มต้นของเส้นทางสู่การเป็นแชมป์โลกสำหรับคุณ Viswanathan Anand คนที่กลายมาเป็นส่วนหนึ่งในหน้าประวติศาสตร์หมากรุกไปตลาดกาล ตอนนี้ก็มีอีกตำนานมาอยู่ในทีม InstaSpot แล้ว!


Borussia เป็นหนึ่งในสโมสรฟุตบอลขึ้นชื่อในประเทศเยอรมนี ที่ได้พิสูจน์ให้กับเหล่าแฟนๆเห็นแล้วถึงจิตวิญญาณของการแข่งขัน และการขึ้นมาสู่จุดสูงสุด เพื่อจะมุ่งหน้าสู่ความสำเร็จ การเทรดเองก็เหมือนกับการเล่นกีฬาอย่างมืออาชีพในการแข่งขัน โดยต้องมีความมั่นใจและการไม่หยุดนิ่ง เพื่อที่จะได้ "ผ่าน" จากสโมสร Borussia FC และขึ้นมาอยู่ในอันดับต้นไปพร้อมกับ InstaSpot!

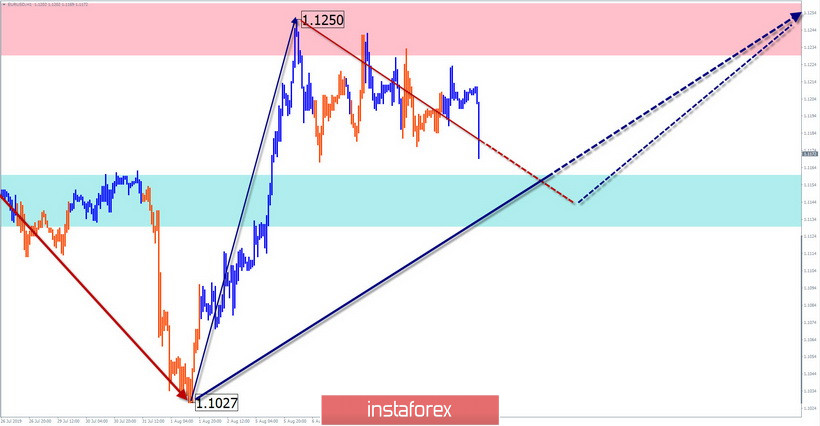
EUR/USD
Starting from August 1, the direction of the short-term trend of the euro was set by the upward wave structure. Within its framework, a flat correction has developed over the past week.
Forecast:
In the coming days, there is a high probability of completion of the current downward movement in the last days. A short puncture of the lower boundary of the zone is not excluded. By the end of the day, the formation of a reversal and the beginning of a price rise is expected.
Recommendations:
There are no conditions for selling the euro today. It is recommended to track the reversal signals in the area of the calculated support, with the search for the entry point in the long positions for this pair.
Resistance zone:
- 1.1230/1.1260
Support zone:
- 1.1160/1.1130
AUD/USD
On the hourly chart of "Aussie", the rising wave from August 7 has a high wave level, claiming to start a larger wave model. At least a full correction of the previous trend wave from July 19 is expected. Within the framework of the structure that has begun, a rollback is developing in recent days.
Forecast:
Today, the completion of the downward phase of the movement, lasting from last Thursday, is expected. The breakthrough of the lower boundary of the zone is not excluded, but unlikely. The price reversal and the beginning of the price rise are more likely in the second half of the day.
Recommendations:
The pair's sales are risky today, due to the expected low price move down. In the support area, it is recommended to pay attention to the emerging signals of buying the instrument.
Resistance zone:
- 0.6840/0.6870
Support zone:
- 0.6770/0.6740

Explanations to the figures: Waves in the simplified wave analysis consist of 3 parts (A-B-C). The last unfinished wave is analyzed. Zones show areas with the highest probability of reversal. The arrows indicate the wave marking according to the method used by the author, the solid background is the formed structure, the dotted ones are the expected movements.
Attention: The wave algorithm does not take into account the length of time the instrument moves.
*บทวิเคราะห์ในตลาดที่มีการโพสต์ตรงนี้ เพียงเพื่อทำให้คุณทราบถึงข้อมูล ไม่ได้เป็นการเจาะจงถึงขั้นตอนให้คุณทำการซื้อขายตาม
บทวิเคราะห์ของทาง InstaSpot จะทำให้คุณทราบถึงแนวโน้มของตลาด! ในการที่เป็นลูกค้าของทาง InstaSpot นั้นคุณจะได้รับการบริการเพื่อการซื้อขายอย่างเต็มประสิทธิภาพอย่างมากมาย


