


Legenda tim InstaSpot!
Legenda! Anda pikir legenda adalah retorika yang bombastis? Lalu, bagaimana menyebut seorang pria, seorang Asia pertama yang memenangkan kejuaraan catur dunia junior pada usia 18 tahun, dan yang menjadi Grandmaster India pertama pada usia 19 tahun? Itulah awal perjalanan yang sulit dalam meraih gelar Juara Dunia bagi Viswanathan Anand, pria yang menjadi bagian dari sejarah catur untuk selamanya. Sekarang, satu lagi legenda masuk ke dalam tim InstaSpot!


Borussia merupakan salah satu klub sepakbola paling terkenal di Jerman, yang telah berulang kali membuktikan pada para penggemarnya: semangat kompetisi dan kepemimpinan pasti akan mengarah pada kesuksesan. Lakukan trading dengan cara yang sama seperti para profesional olahraga: percaya diri dan aktif. Gunakan "kunci" dari Borussia FC dan jadilah yang terdepan bersama InstaSpot!

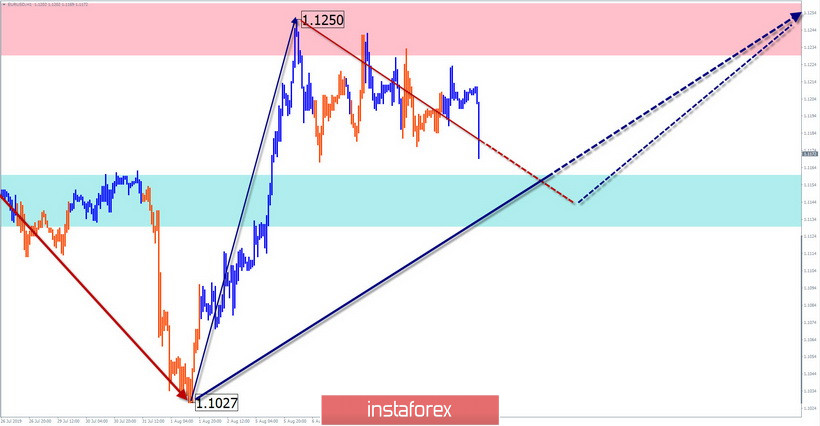
EUR/USD
Starting from August 1, the direction of the short-term trend of the euro was set by the upward wave structure. Within its framework, a flat correction has developed over the past week.
Forecast:
In the coming days, there is a high probability of completion of the current downward movement in the last days. A short puncture of the lower boundary of the zone is not excluded. By the end of the day, the formation of a reversal and the beginning of a price rise is expected.
Recommendations:
There are no conditions for selling the euro today. It is recommended to track the reversal signals in the area of the calculated support, with the search for the entry point in the long positions for this pair.
Resistance zone:
- 1.1230/1.1260
Support zone:
- 1.1160/1.1130
AUD/USD
On the hourly chart of "Aussie", the rising wave from August 7 has a high wave level, claiming to start a larger wave model. At least a full correction of the previous trend wave from July 19 is expected. Within the framework of the structure that has begun, a rollback is developing in recent days.
Forecast:
Today, the completion of the downward phase of the movement, lasting from last Thursday, is expected. The breakthrough of the lower boundary of the zone is not excluded, but unlikely. The price reversal and the beginning of the price rise are more likely in the second half of the day.
Recommendations:
The pair's sales are risky today, due to the expected low price move down. In the support area, it is recommended to pay attention to the emerging signals of buying the instrument.
Resistance zone:
- 0.6840/0.6870
Support zone:
- 0.6770/0.6740

Explanations to the figures: Waves in the simplified wave analysis consist of 3 parts (A-B-C). The last unfinished wave is analyzed. Zones show areas with the highest probability of reversal. The arrows indicate the wave marking according to the method used by the author, the solid background is the formed structure, the dotted ones are the expected movements.
Attention: The wave algorithm does not take into account the length of time the instrument moves.
*Analisis pasar yang diposting disini dimaksudkan untuk meningkatkan pengetahuan Anda namun tidak untuk memberi instruksi trading.
Tinjauan analitis InstaSpot akan membuat Anda menyadari sepenuhnya tren pasar! Sebagai klien InstaSpot, Anda dilengkapi dengan sejumlah besar layanan gratis untuk trading yang efisien.


