


The legend in the InstaSpot team!
Legend! You think that's bombastic rhetoric? But how should we call a man, who became the first Asian to win the junior world chess championship at 18 and who became the first Indian Grandmaster at 19? That was the start of a hard path to the World Champion title for Viswanathan Anand, the man who became a part of history of chess forever. Now one more legend in the InstaSpot team!


Borussia is one of the most titled football clubs in Germany, which has repeatedly proved to fans: the spirit of competition and leadership will certainly lead to success. Trade in the same way that sports professionals play the game: confidently and actively. Keep a "pass" from Borussia FC and be in the lead with InstaSpot!

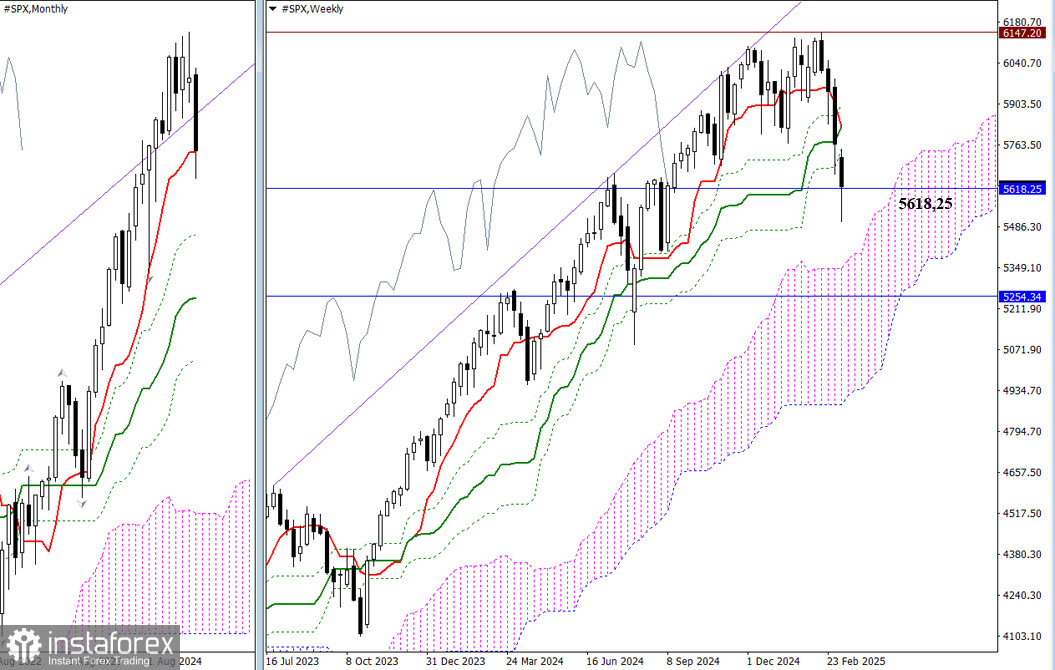
Last week, the bears continued to decline but failed to close below the tested support level of the monthly short-term trend at 5618.25, only leaving a long lower shadow beyond it. A break below this level would lead to a retest of the weekly Ichimoku cross, which ranges from 5749.63, 5825.54 to 5901.45. If a breakdown occurs, it would signify the continuation of the monthly downward correction towards the next support level at 5254.34, which is now reinforced by the weekly Ichimoku cloud, ranging from 5396.85 to 4936.71.
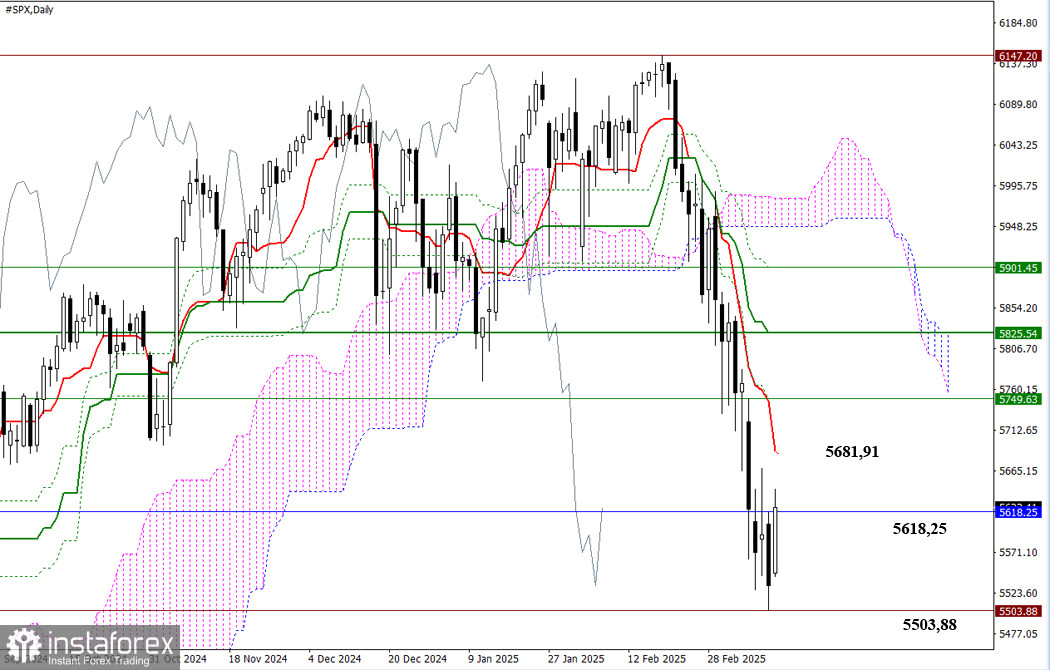
In the daily timeframe, it is evident that after initially dropping below the monthly support level of 5618.25 at the beginning of the week, the SPX has been attempting to recover and consolidate above this lost level for the remainder of the week. If the bulls continue to regain their positions, a full upward correction towards the daily short-term trend at 5681.91 will first need to take place. Conversely, if bearish activity returns to the market, the bears must update the minimum extremum at 5503.88 to unveil new prospects.
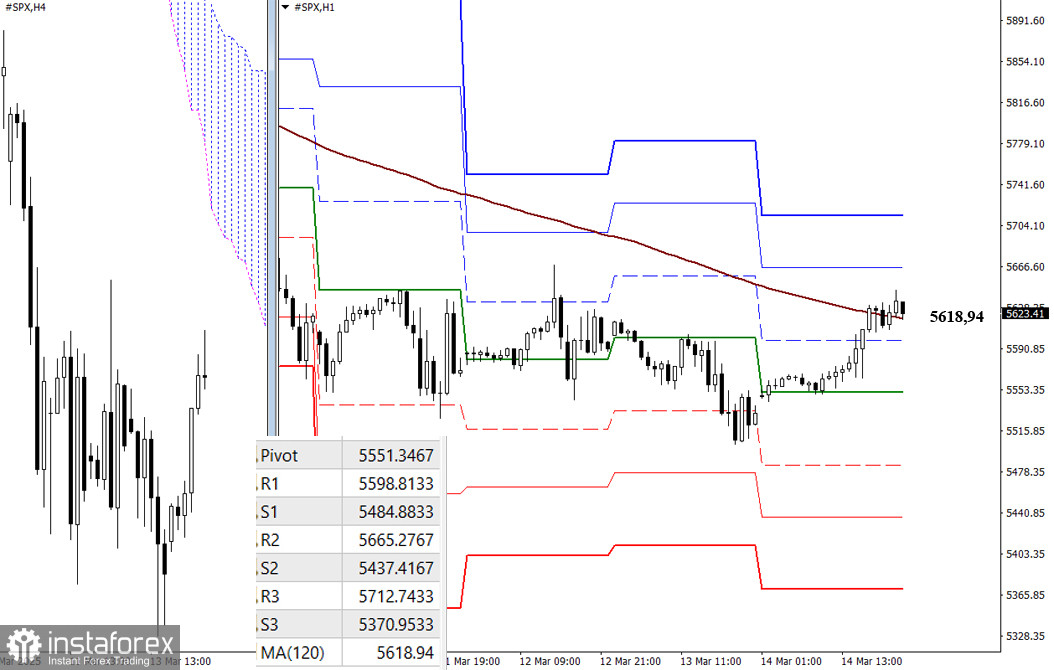
The current weekly long-term trend is at 5618.94 and is being tested on the lower timeframes. Holding above this level provides a significant advantage. If the trend breaks and moves upward, it could strengthen bullish sentiment. Conversely, if there is a retracement and the price moves below the trend, it may indicate a continuation of the downward movement.
Additionally, the supports and resistances indicated by the classic Pivot levels serve as important reference points throughout the day. These levels are updated daily, and new relevant data will become available when the market opens.
***
*Analiza tržišta koja se ovde nalazi namenjena je boljem razumevanju tržišta i ne pruža instrukcije za vršenje trgovanja.
Uz InstaSpot-ove analitičke preglede uvek ćete biti u toku sa tržišnim trendovima! Klijentima InstaSpot-a su dostupni mnogobrojni besplatni servisi za uspešno trgovanje.


