


Naš tim čini više od 7.000.000 trgovaca!
Svakog dana zajedno radimo na unapređenju trgovanja. Ostvarujemo vrhunske rezultate i krećemo se samo napred.
Priznatost od strane miliona trgovaca širom sveta najbolje pokazuje koliko se naš rad ceni! Napravili ste svoj izbor i mi ćemo učiniti sve što je neophodno da zadovoljimo vaša očekivanja!
Zajedno činimo sjajan tim!
InstaSpot. Sa ponosom radi za Vas!


Glumac, šampion UFC turnira i pravi heroj!
Čovek koji je ostvario sebe. Čovek koji hoda uz nas.
Tajna uspeha Taktarova jeste stalno kretanje ka svom cilju.
Otkrijte sve strane svog talenta!
Istražuj, pokušaj, padni - ali se nikad ne zaustavljaj!
InstaSpot. Priča Vašeg uspeha započinje ovde!

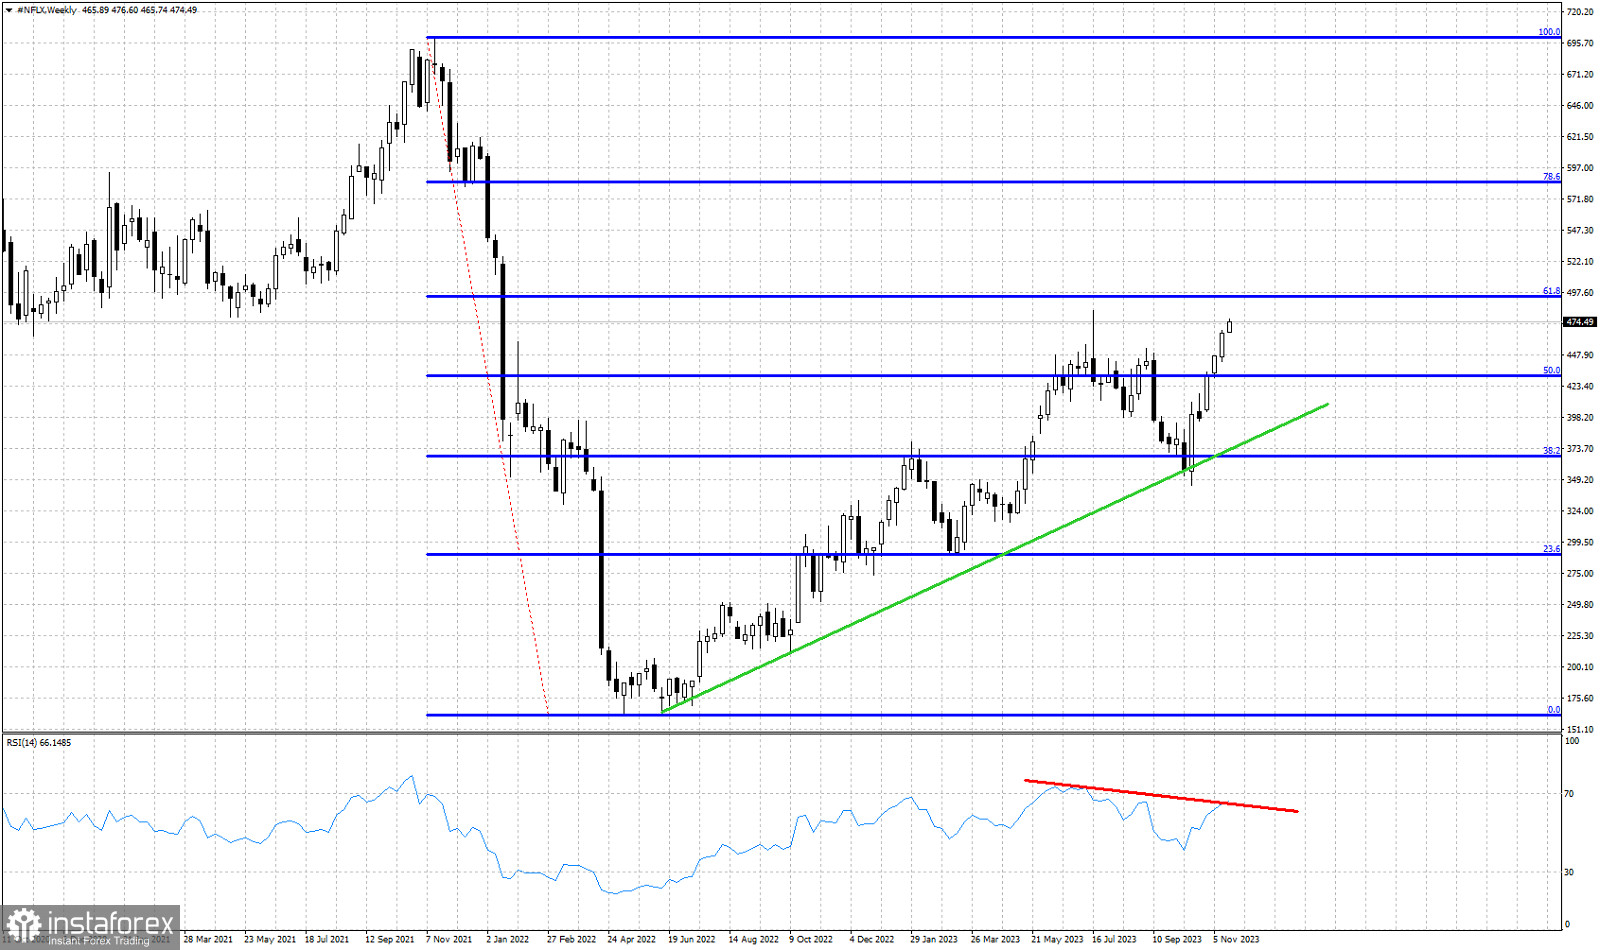
Red lines- bearish RSI divergence
Blue lines- Fibonacci retracement levels
Green line- support trend line
NFLX stock price is trading around $474 making new highs relative to last week and breaking above levels not seen since July. Price is approaching once again the major Fibonacci resistance level at $492. NFLX stock price is currently in an impressive vertical run to the upside erasing the losses of the last few months. Last week's close was above the highest weekly close of 2023. Only on intraday basis has price seen higher levels at $483 back in July. Current momentum suggests that we will break above this level and re-test the 61.8% Fibonacci retracement. The bearish RSI divergence is a warning that should not be ignored. However we have no weekly reversal signal. The Green trend line providing support at $374 remains our key indicator of the medium-term trend. A rejection at the 61.8% retracement will create a double top. This is not something bulls want to see.
*Analiza tržišta koja se ovde nalazi namenjena je boljem razumevanju tržišta i ne pruža instrukcije za vršenje trgovanja.
Uz InstaSpot-ove analitičke preglede uvek ćete biti u toku sa tržišnim trendovima! Klijentima InstaSpot-a su dostupni mnogobrojni besplatni servisi za uspešno trgovanje.


