




Brief Analysis:
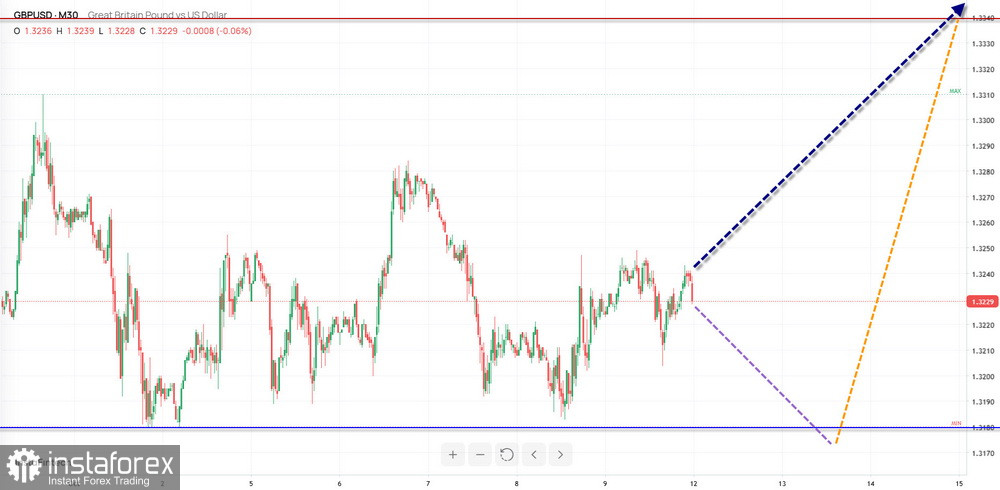
At the end of January this year, the trend on the GBP/USD major pair chart reversed. The upward trend gave way to a corrective bearish wave, which remains incomplete. After reaching the upper boundary of a major support zone, the price entered a sideways drift, forming an intermediate correction within the final segment (C) of the main wave.
Weekly Forecast:
Over the coming week, GBP/USD is expected to continue trading within a sideways range between the nearest opposing zones. After possible pressure on the support zone at the beginning of the week, a bullish move is the most likely scenario. The upward move is expected to end near the calculated resistance zone.
Potential Reversal Zones
Resistance:
Support:
Recommendations
Selling: Offers little potential and carries significant risk.
Buying: Buying is premature until the current decline is fully complete and the relevant signals from your trading systems appear near the support zone.
Brief Analysis:
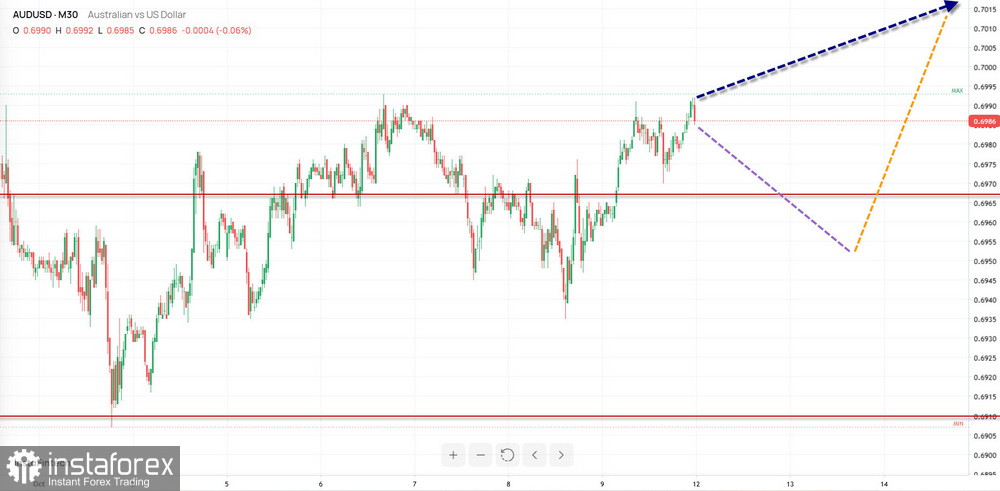
Since the end of January, the downward wave structure has been determining the direction of short-term price fluctuations in the AUD/USD major pair. The current incomplete wave segment began on September 9. Over the past three weeks, a countertrend correction has been developing within this segment. As of the time of analysis, its structure does not indicate completion.
Weekly Forecast:
Over the coming week, AUD/USD is expected to trade within a price range bounded by opposing zones. Following a likely pullback and an attempt to test the support zone, a reversal and a change in the direction of price movement may follow. The resistance zone indicates the most likely upper boundary of the pair's weekly trading range.
Potential Reversal Zones
Resistance:
Support:
Recommendations
Selling: Downward potential is limited, and selling may result in losses to the trading account.
Buying: Buying opportunities may arise once confirmed reversal signals from your trading systems appear near the support zone.
Brief Analysis:
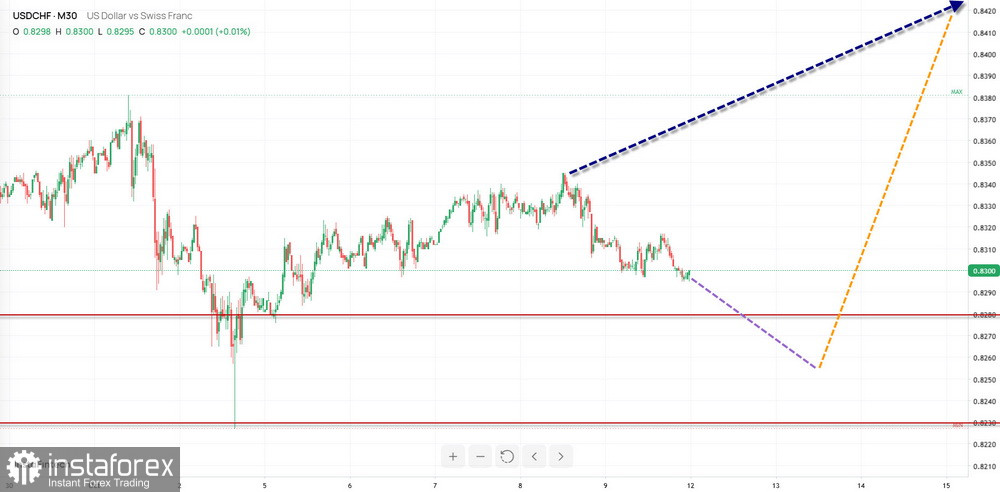
An upward wave has been determining the direction of the Swiss franc's price trend since the beginning of April last year. The wave is developing in one of two possible forms: a running flat or an elongated flat. The final segment (C) has been developing throughout the current year, and the wave remains incomplete. After breaking through strong resistance, the price has been moving along a major potential reversal level on a higher timeframe over the past three weeks.
Weekly Forecast:
At the beginning of the coming week, the decline is expected to continue, followed by sideways movement along the boundaries of the calculated support zone. Toward the end of the week, conditions may develop for the downward move to resume. The resistance level indicates the upper boundary of the pair's expected weekly trading range.
Potential Reversal Zones
Resistance:
Support:
Recommendations
Selling: Selling opportunities may arise during individual trading sessions using small position sizes.
Buying: Buying may become viable once the relevant reversal signals appear near the support zone.
Brief Analysis:
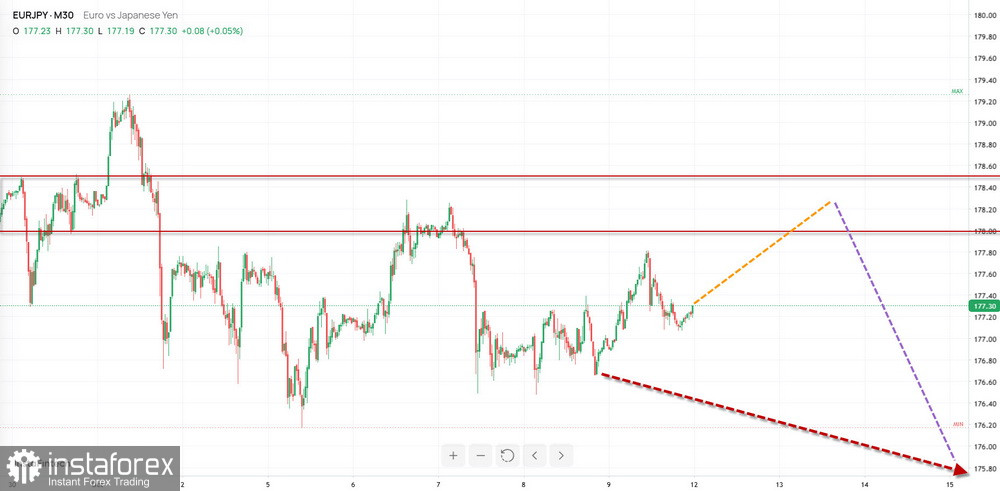
Since mid-April of this year, a downward wave structure has been determining the direction of price fluctuations in the EUR/JPY pair. Analysis of the global trend structure on the daily timeframe indicates that an internal correction is developing within the final segment (C). In recent days, following a break below strong support, the pair's price has rebounded upward from major resistance levels on a higher timeframe.
Weekly Forecast:
During the first few days of the coming week, sideways movement is the most likely scenario. A brief rise toward the boundaries of the reversal zone is possible. The downward move may resume closer to the end of the week. Increased volatility and a change in direction may coincide with the release of important economic data.
Potential Reversal Zones
Resistance:
Support:
Recommendations
Buying: Upward potential is limited, and buying carries a high level of risk.
Selling: Selling may be considered once the relevant reversal signals appear.
Analysis:
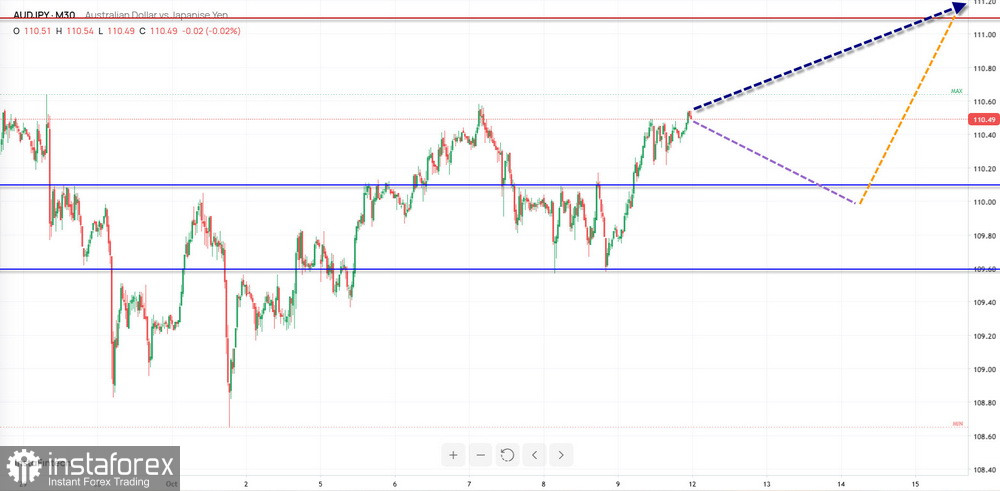
The broader trend in the AUD/JPY pair is pushing prices toward the upper end of the price range. Since August 3, the pair has been forming a new segment of the main wave in the form of an elongated flat. The middle segment (B) remains incomplete. Since the beginning of October, the price has been pulling back from the upper boundary of a strong potential reversal zone.
Forecast:
Over the next few days, a downward move is highly likely. The decline is expected to end near the support zone, where a reversal may begin to form. Toward the end of the week, the pair may reverse and begin rising. The resistance boundary indicates the most likely upper limit of the pair's weekly trading range.
Potential Reversal Zones
Resistance:
Support:
Recommendations:
Selling: Selling opportunities may arise in intraday trading using reduced position sizes.
Buying: Buying may become viable once reversal signals appear near the support zone.
Brief Analysis:
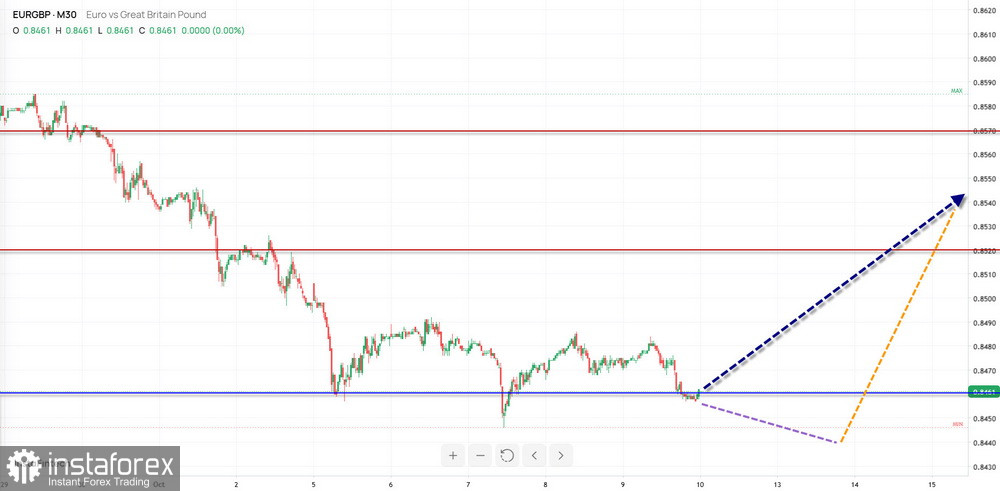
Since September 17, the direction of the EUR/GBP pair's short-term trend has been determined by a bearish wave structure. The current incomplete wave segment is corrective and began on October 5. Over the past week, the price has been moving predominantly sideways along the upper boundary of a major potential reversal zone on a higher timeframe.
Weekly Forecast:
Over the next few days, the cross is expected to continue moving sideways. A decisive break below the lower boundary of the calculated support zone is unlikely. A reversal and a resumption of the upward move are possible closer to the end of the week. The resistance zone indicates the upper boundary of the expected weekly trading range.
Potential Reversal Zones
Resistance:
Support:
Recommendations
Selling: Offers little potential and carries a high level of risk.
Buying: Buying may be considered once buy signals appear in your trading systems.
Notes: Under simplified wave analysis (SWA), all waves consist of three segments (A-B-C). The latest incomplete wave is analyzed on each timeframe. Expected price movements are indicated by dashed lines.
Warning: The wave algorithm does not take into account the time required for instruments to complete their price movements.
*تعینات کیا مراد ہے مارکیٹ کے تجزیات یہاں ارسال کیے جاتے ہیں جس کا مقصد آپ کی بیداری بڑھانا ہے، لیکن تجارت کرنے کے لئے ہدایات دینا نہیں.
InstaSpot analytical reviews will make you fully aware of market trends! Being an InstaSpot client, you are provided with a large number of free services for efficient trading.










