




ہمارے ٹیم میں 7000000 سے ذائد تاجران شامل ہیں
ہم تجارت کی بہتری کے لئے ہر روز اکھٹے کام کرتے ہیں اور بہترین نتائج حاصل کرتے ہوئے آگے کی جانب بڑھتے ہیں
دُنیا بھر سے سے لاکھوں ہمارے بہترین کام کو سند عطاء کرتے ہیں آپ اپنا انتحاب کریں باقی ہم آپ کی توقعات پر پورا اترنے کے لئے اپنی بہترین کوشش کریں گے
ہم مل کر ایک بہترین ٹیم بناتے ہیں
انسٹا فاریکس آپ سے کام کرتے ہوئے فخر محسوس کرتا ہے





ایکٹر - یو سی ایف 6 ٹورنامنٹ چیمپین اور واقعی ہیرو
ایک فرد کے جس نے اپنا آپ منوایا ہے وہ فرد کہ جو ہماری راہ پر چلا ہے.
ٹکٹا روو کی کامیابی کا راز یہ ہے کہ وہ اپنے اہداف کی جانب مسلسل بڑھتا رہتا ہے
اپنے ہنر یا ٹیلنٹ کے تمام پہلو آشکار کررہے ہیں
پہچانیں ، کوشش کریں ، ناکام ہوں لیکن کبھی نہ رُکیں
انسٹا فاریکس آپ کی کامیابی کی کہاں یہاں سے شروع ہوتی ہے

Bitcoin and Ethereum declined during the first half of the day, but overall, trading remains within an upward corrective channel.

Meanwhile, the BVIV index, which tracks 30-day implied Bitcoin volatility on an annualized basis, also declined. The indicator fell to 35.59%, its lowest level since September. This indicator serves as a cryptocurrency equivalent of the VIX in the traditional stock market: the higher the demand for options protection against price fluctuations, the higher the index. Therefore, its sharp decline indicates a fading of fear rather than optimism as such. For comparison, BVIV rose above 90% in early February, when Bitcoin plunged from $90,000 to almost $60,000 and traders massively bought options to hedge against sharp price swings.
The current calm can be explained by an imbalance between supply and demand in the options market. As long as the price remains firmly within the established range, interest in so-called directional options trading through call or put options on a significant price move in either direction has simply disappeared. Traders have stopped buying protection because they see no reason to position for a sharp surge or collapse, and this decline in demand has directly contributed to the decrease in BVIV.
A structural shift in the behavior of large holders is also playing a key role in suppressing volatility. The effect is further reinforced by the typical mid-year summer lull. Due to reduced trader activity during the holiday season, realized volatility—the actual amplitude of price movements—has declined, which is also putting downward pressure on volatility.
As for short-term trading, the strategy and conditions are outlined below.
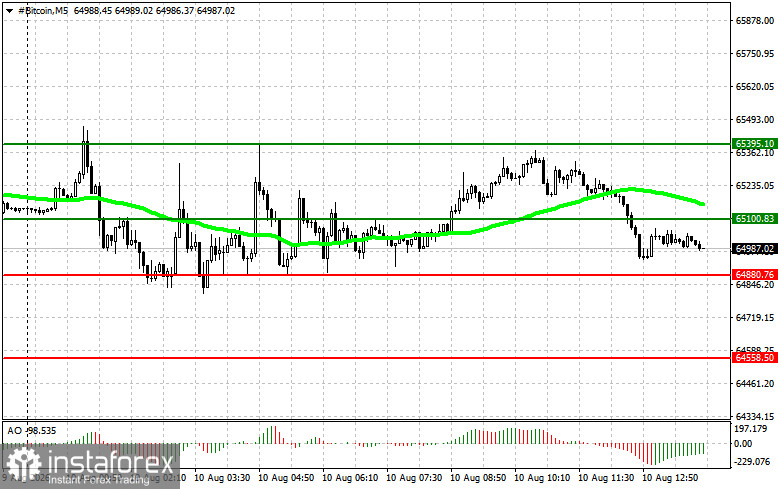
Scenario #1: Today, I will buy Bitcoin when the entry point is reached around $65,100, targeting a rise to $65,400. Around $65,400, I will close the long position and immediately look for a short position on a rebound. Before buying a breakout, it is necessary to make sure that the 50-day moving average is below the current price and that the Awesome Oscillator is above zero.
Scenario #2: Bitcoin can be bought from the lower boundary at $64,800 if there is no market reaction to a break below this level, followed by a return toward $65,100 and $65,400.
Scenario #1: Today, I will sell Bitcoin when the entry point is reached around $64,800, targeting a decline to $64,500. Around $64,500, I will close the short position and immediately look for a long position on a rebound. Before selling a breakout, it is necessary to make sure that the 50-day moving average is above the current price and that the Awesome Oscillator is below zero.
Scenario #2: Bitcoin can be sold from the upper boundary at $65,100 if there is no market reaction to a break above this level, followed by a return toward $64,800 and $64,500.
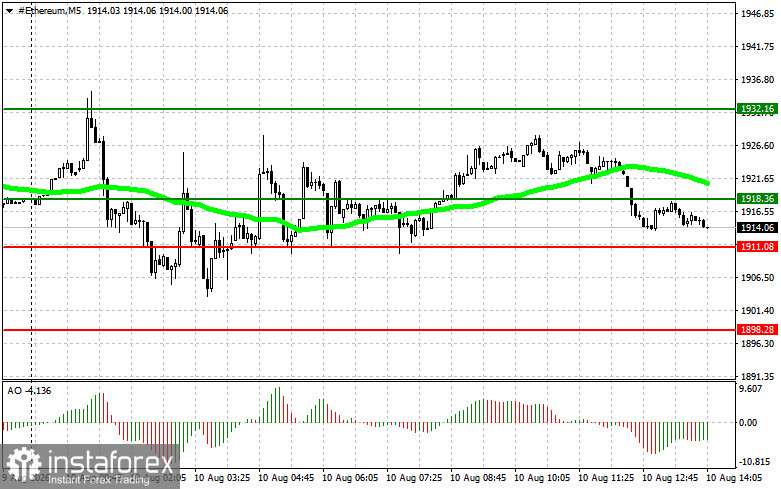
Scenario #1: Today, I will buy Ethereum when the entry point is reached around $1,918, targeting a rise to $1,932. Around $1,932, I will close the long position and immediately look for a short position on a rebound. Before buying a breakout, it is necessary to make sure that the 50-day moving average is below the current price and that the Awesome Oscillator is above zero.
Scenario #2: Ethereum can be bought from the lower boundary at $1,911 if there is no market reaction to a break below this level, followed by a return toward $1,918 and $1,932.
Scenario #1: Today, I will sell Ethereum when the entry point is reached around $1,911, targeting a decline to $1,898. Around $1,898, I will close the short position and immediately look for a long position on a rebound. Before selling a breakout, it is necessary to make sure that the 50-day moving average is above the current price and that the Awesome Oscillator is below zero.
Scenario #2: Ethereum can be sold from the upper boundary at $1,918 if there is no market reaction to a break above this level, followed by a return toward $1,911 and $1,898.
*تعینات کیا مراد ہے مارکیٹ کے تجزیات یہاں ارسال کیے جاتے ہیں جس کا مقصد آپ کی بیداری بڑھانا ہے، لیکن تجارت کرنے کے لئے ہدایات دینا نہیں.
InstaSpot analytical reviews will make you fully aware of market trends! Being an InstaSpot client, you are provided with a large number of free services for efficient trading.


