




ہمارے ٹیم میں 7000000 سے ذائد تاجران شامل ہیں
ہم تجارت کی بہتری کے لئے ہر روز اکھٹے کام کرتے ہیں اور بہترین نتائج حاصل کرتے ہوئے آگے کی جانب بڑھتے ہیں
دُنیا بھر سے سے لاکھوں ہمارے بہترین کام کو سند عطاء کرتے ہیں آپ اپنا انتحاب کریں باقی ہم آپ کی توقعات پر پورا اترنے کے لئے اپنی بہترین کوشش کریں گے
ہم مل کر ایک بہترین ٹیم بناتے ہیں
انسٹا فاریکس آپ سے کام کرتے ہوئے فخر محسوس کرتا ہے





ایکٹر - یو سی ایف 6 ٹورنامنٹ چیمپین اور واقعی ہیرو
ایک فرد کے جس نے اپنا آپ منوایا ہے وہ فرد کہ جو ہماری راہ پر چلا ہے.
ٹکٹا روو کی کامیابی کا راز یہ ہے کہ وہ اپنے اہداف کی جانب مسلسل بڑھتا رہتا ہے
اپنے ہنر یا ٹیلنٹ کے تمام پہلو آشکار کررہے ہیں
پہچانیں ، کوشش کریں ، ناکام ہوں لیکن کبھی نہ رُکیں
انسٹا فاریکس آپ کی کامیابی کی کہاں یہاں سے شروع ہوتی ہے

Bitcoin reached a new weekly high, climbing to $64,400 today. Ethereum also posted gains and appears poised to test the $1,800 level in the near term.

Meanwhile, the Bitcoin-to-gold ratio has fallen to its lowest level in several years, drawing increasing attention from analysts across both markets. This ratio measures the relative strength of two assets traditionally viewed as competing stores of value, and its sharp decline highlights just how significantly their performance has diverged in 2026.
Gold, supported by a weaker US dollar and rising geopolitical tensions, has continued to climb to new record highs. Meanwhile, after peaking near $126,000 at the end of last year, Bitcoin entered a prolonged consolidation phase and is now trading around $62,800.
Notably, despite their different trajectories, both assets rank among the weakest-performing major assets of 2026. Bitcoin has declined by approximately 31% since the beginning of the year, while gold has lost around 6%. This makes the current decline in the Bitcoin-to-gold ratio even more significant, as it is occurring not because of a strong rally in gold, but because both assets have weakened simultaneously, with Bitcoin simply underperforming gold.
Historically, this pattern has often pointed to the potential for a market reversal. Previous periods in which the Bitcoin-to-gold ratio reached similarly oversold levels coincided with the formation of major market bottoms in Bitcoin, followed by sustained recoveries. During such periods, capital that had shifted into gold as a safe-haven asset during times of macroeconomic uncertainty gradually flowed back into Bitcoin as market conditions stabilized.
However, it is important to recognize that this is a lagging and relatively long-term indicator. Therefore, investors should not expect a sharp rally in the cryptocurrency market—or the beginning of a new bull market—in the immediate future.
As for short-term trading, the strategy and trading scenarios are outlined below.
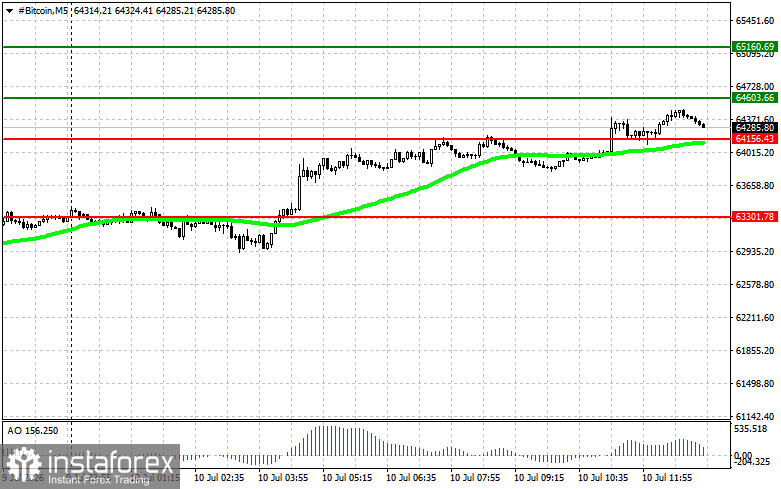
Scenario 1: I will consider buying Bitcoin upon a breakout to $64,600, targeting $65,100. Around $65,100, I plan to close long positions and consider opening short positions on a rebound. Before buying the breakout, make sure that the 50-day Moving Average is below the current price and that the Awesome Oscillator is in positive territory.
Scenario 2: Bitcoin can also be bought from the $64,100 support level if a breakout below this level fails, targeting a recovery toward $64,600 and $65,100.
Scenario 1: I will consider selling Bitcoin upon a breakout below $64,100, targeting $63,300. Around $63,300, I plan to close short positions and consider opening long positions on a rebound. Before selling the breakout, make sure that the 50-day Moving Average is above the current price and that the Awesome Oscillator is in negative territory.
Scenario 2: Bitcoin can also be sold from the $64,600 resistance level if a breakout above this level fails, targeting a decline toward $64,100 and $63,300.
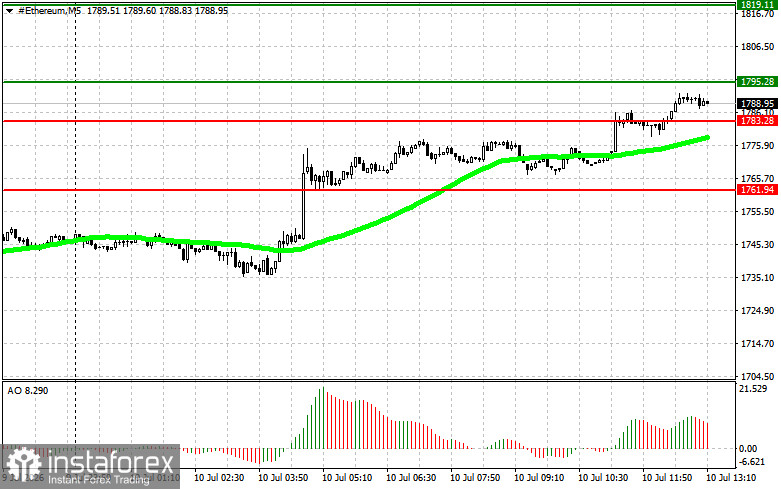
Scenario 1: I will consider buying Ethereum upon a breakout to $1,795, targeting $1,819. Around $1,819, I plan to close long positions and consider opening short positions on a rebound. Before buying the breakout, make sure that the 50-day Moving Average is below the current price and that the Awesome Oscillator is in positive territory.
Scenario 2: Ethereum can also be bought from the $1,783 support level if a breakout below this level fails, targeting a recovery toward $1,795 and $1,819.
Scenario 1: I will consider selling Ethereum upon a breakout below $1,783, targeting $1,761. Around $1,761, I plan to close short positions and consider opening long positions on a rebound. Before selling the breakout, make sure that the 50-day Moving Average is above the current price and that the Awesome Oscillator is in negative territory.
Scenario 2: Ethereum can also be sold from the $1,795 resistance level if a breakout above this level fails, targeting a decline toward $1,783 and $1,761.
*تعینات کیا مراد ہے مارکیٹ کے تجزیات یہاں ارسال کیے جاتے ہیں جس کا مقصد آپ کی بیداری بڑھانا ہے، لیکن تجارت کرنے کے لئے ہدایات دینا نہیں.
InstaSpot analytical reviews will make you fully aware of market trends! Being an InstaSpot client, you are provided with a large number of free services for efficient trading.


