


ہمارے ٹیم میں 7000000 سے ذائد تاجران شامل ہیں
ہم تجارت کی بہتری کے لئے ہر روز اکھٹے کام کرتے ہیں اور بہترین نتائج حاصل کرتے ہوئے آگے کی جانب بڑھتے ہیں
دُنیا بھر سے سے لاکھوں ہمارے بہترین کام کو سند عطاء کرتے ہیں آپ اپنا انتحاب کریں باقی ہم آپ کی توقعات پر پورا اترنے کے لئے اپنی بہترین کوشش کریں گے
ہم مل کر ایک بہترین ٹیم بناتے ہیں
انسٹا فاریکس آپ سے کام کرتے ہوئے فخر محسوس کرتا ہے


ایکٹر - یو سی ایف 6 ٹورنامنٹ چیمپین اور واقعی ہیرو
ایک فرد کے جس نے اپنا آپ منوایا ہے وہ فرد کہ جو ہماری راہ پر چلا ہے.
ٹکٹا روو کی کامیابی کا راز یہ ہے کہ وہ اپنے اہداف کی جانب مسلسل بڑھتا رہتا ہے
اپنے ہنر یا ٹیلنٹ کے تمام پہلو آشکار کررہے ہیں
پہچانیں ، کوشش کریں ، ناکام ہوں لیکن کبھی نہ رُکیں
انسٹا فاریکس آپ کی کامیابی کی کہاں یہاں سے شروع ہوتی ہے

The wave pattern on the 4-hour chart of EUR/USD has evolved. There is still no reason to suggest that the broader upward trend segment (shown in the lower chart), which began in January of last year, has been canceled. However, the trend's wave structure has now taken on a corrective form.
From a long-term perspective, a wave C formation can be expected, with its low positioned below the low of wave A. At present, it is difficult to believe in such a substantial decline of the euro, but the first quarter of 2026 demonstrated that geopolitical developments can dramatically alter market trends.
On a lower time frame, I can identify a classic five-wave bearish structure. Once this structure is complete, the pair may transition into a new upward wave sequence, and at this stage the bearish structure appears complete. Therefore, a rise in the euro can be expected from the 1.1513 level, which corresponds to the 76.4% Fibonacci retracement level.
However, without support from geopolitical developments and the ECB, any appreciation of the euro is likely to face significant difficulties.
The EUR/USD pair gained 40 points on Tuesday, responding to a reduction in geopolitical tensions in the Middle East. Today, markets learned that Israel and Iran, with mediation from Donald Trump, had agreed to cease military operations. The U.S. president also stated that a deal with Iran would be signed within the next two weeks and that the United States would achieve a complete victory over its adversary.
Trump further claimed that Iran is highly interested in reaching an agreement with the United States and is prepared to surrender its nuclear weapons. All that remains is to wait for the next round of denials from Tehran.
It should be remembered that this is far from the first time Donald Trump has promised—or even declared—a complete victory over Iran. Frankly speaking, it remains unclear whether the United States has already achieved victory or is still preparing to do so.
The nuclear issue also remains unclear. Senior Iranian officials, including Abbas Araghchi and Mojtaba Khamenei, have repeatedly stated that the nuclear issue is not even part of the current negotiations and that Iran's abandonment of uranium enrichment is impossible.
I can assume that Tehran might agree to a nuclear deal similar to the one that existed in 2015. However, no such proposal is currently being offered. Trump is demanding the removal of all enriched uranium from Iran, an end to any future enrichment activities, and the closure of nuclear facilities.
I may be mistaken, but it seems to me that markets have once again received a fresh dose of misinformation from the White House.
It should also be remembered that Trump has already promised approximately twenty times that a peace agreement with Iran would be signed "within the next few days." At times, it resembles a form of neuro-linguistic programming. The impression is that by repeating the same message over and over again, Trump hopes to convince the world—and Iran in particular—that a deal is inevitable.
Whether this strategy will prove successful remains uncertain, but so far it has produced few tangible results. Nevertheless, the market appears to appreciate the U.S. president's optimism.
Today, demand for the U.S. dollar weakened as geopolitical risks declined.
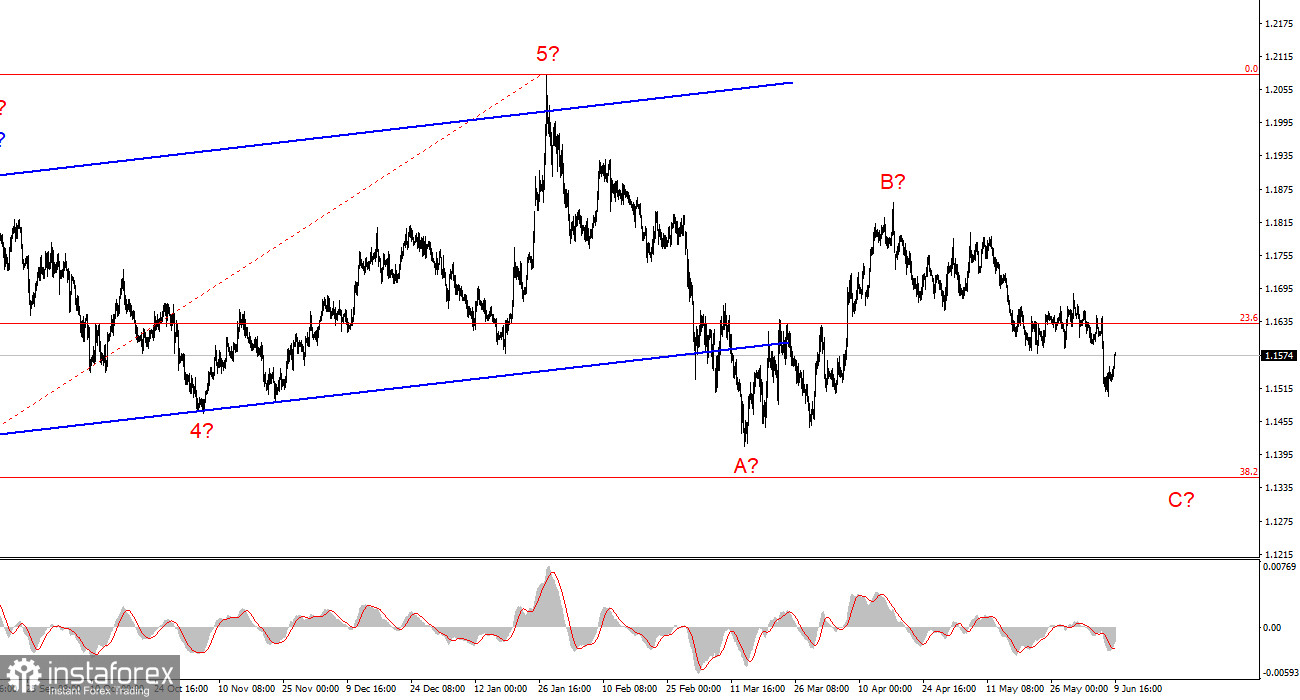
Based on my EUR/USD analysis, I conclude that the pair remains within a broader upward trend segment (shown in the lower chart), while in the shorter term it remains within a downward trend segment that may already be complete.
In my view, the current environment offers a reasonable opportunity to consider building long positions. The failed attempt to break below 1.1513, which corresponds to the 76.4% Fibonacci retracement level, combined with the completed appearance of the bearish trend segment, suggests that the pair may transition into a new upward wave sequence with targets near the 1.1700 level and above.
On the higher time frame, an upward trend segment remains visible, followed by the formation of a corrective wave structure. In the near future, wave C is expected to develop with targets around 1.1352, corresponding to the 38.2% Fibonacci retracement level.
Once the A-B-C corrective structure is complete, a new long-term bullish trend may begin.
*تعینات کیا مراد ہے مارکیٹ کے تجزیات یہاں ارسال کیے جاتے ہیں جس کا مقصد آپ کی بیداری بڑھانا ہے، لیکن تجارت کرنے کے لئے ہدایات دینا نہیں.
InstaSpot analytical reviews will make you fully aware of market trends! Being an InstaSpot client, you are provided with a large number of free services for efficient trading.


