


ہمارے ٹیم میں 7000000 سے ذائد تاجران شامل ہیں
ہم تجارت کی بہتری کے لئے ہر روز اکھٹے کام کرتے ہیں اور بہترین نتائج حاصل کرتے ہوئے آگے کی جانب بڑھتے ہیں
دُنیا بھر سے سے لاکھوں ہمارے بہترین کام کو سند عطاء کرتے ہیں آپ اپنا انتحاب کریں باقی ہم آپ کی توقعات پر پورا اترنے کے لئے اپنی بہترین کوشش کریں گے
ہم مل کر ایک بہترین ٹیم بناتے ہیں
انسٹا فاریکس آپ سے کام کرتے ہوئے فخر محسوس کرتا ہے


ایکٹر - یو سی ایف 6 ٹورنامنٹ چیمپین اور واقعی ہیرو
ایک فرد کے جس نے اپنا آپ منوایا ہے وہ فرد کہ جو ہماری راہ پر چلا ہے.
ٹکٹا روو کی کامیابی کا راز یہ ہے کہ وہ اپنے اہداف کی جانب مسلسل بڑھتا رہتا ہے
اپنے ہنر یا ٹیلنٹ کے تمام پہلو آشکار کررہے ہیں
پہچانیں ، کوشش کریں ، ناکام ہوں لیکن کبھی نہ رُکیں
انسٹا فاریکس آپ کی کامیابی کی کہاں یہاں سے شروع ہوتی ہے

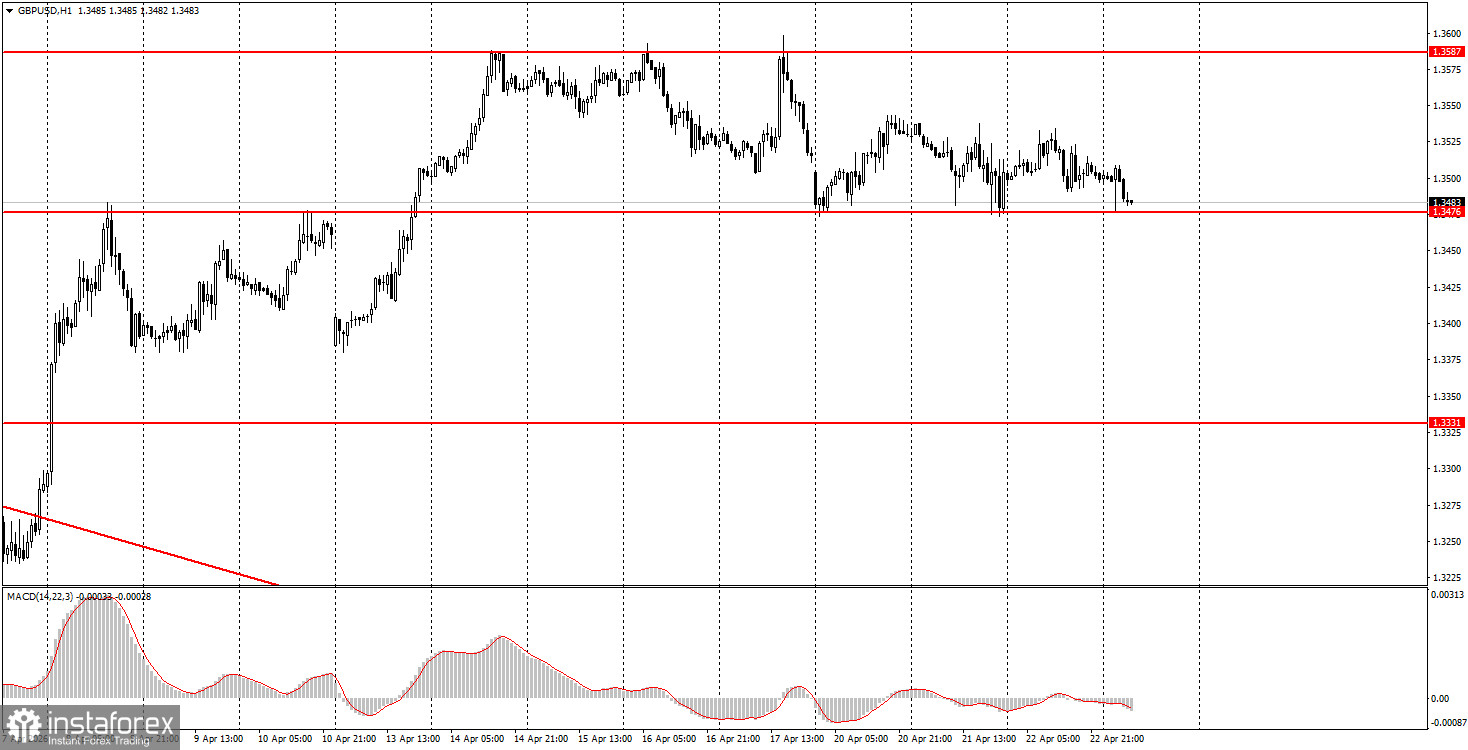
The GBP/USD pair traded with low volatility and a minimal downward bias on Wednesday. However, the British currency has been trading within a sideways channel between 1.3476 and 1.3587 for over a week. The market is not eager to engage in active trading at the moment, as it awaits a resolution in the Middle East. Recall that the second round of negotiations between Tehran and the US will not take place; the blockade of the Strait of Hormuz continues, and the silence regime remains in effect. However, this situation does not satisfy traders. They need clarity: either further war, or a freeze of the conflict, or negotiations and a truce. Currently, none of these options is available. Thus, the market simply continues to wait. Yesterday, the UK also published its March inflation report, which showed rather bland results. The inflation rate rose to 3.3%, in line with forecasts. Consequently, there was no reaction to this report, and overall, the market continues to ignore the macroeconomic background.
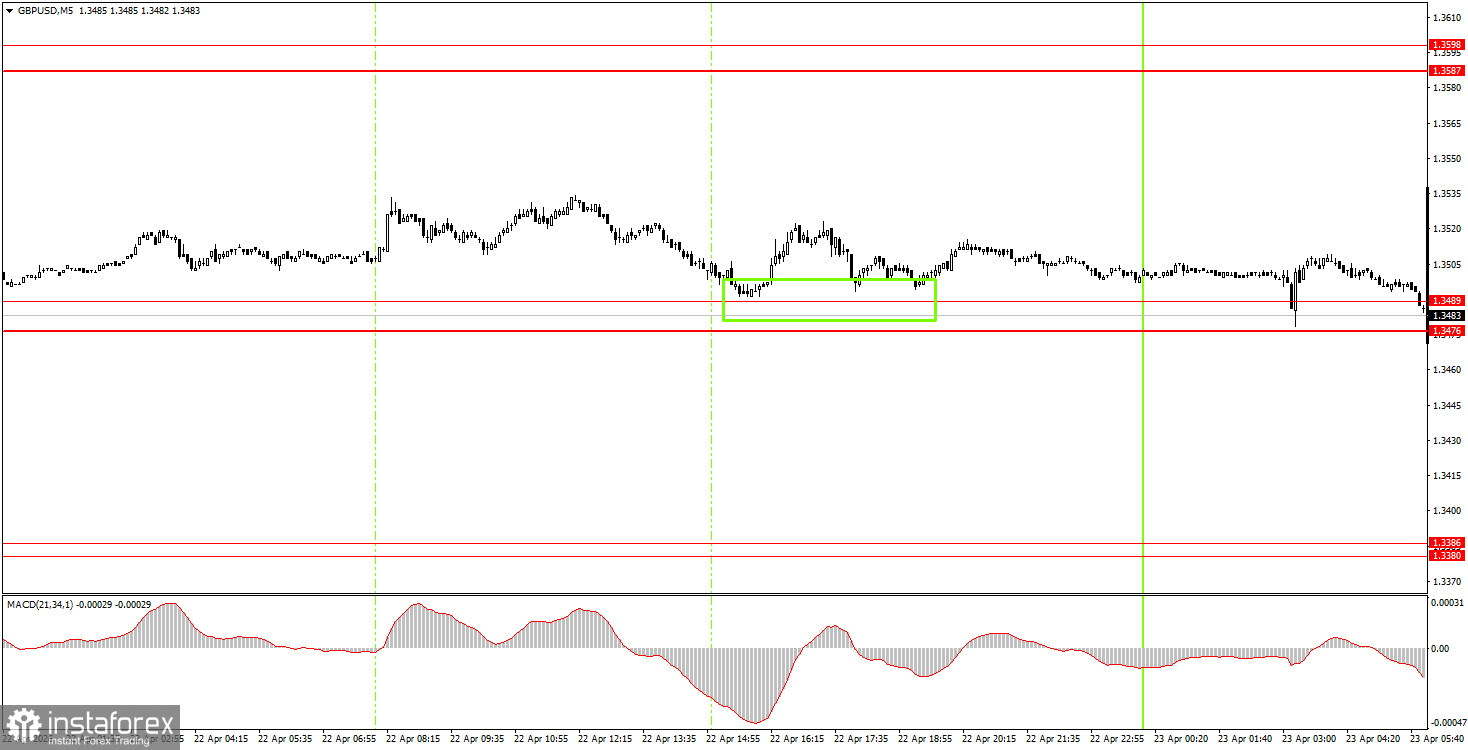
On the 5-minute timeframe, one trading signal was generated on Wednesday, a price bounce from the area of 1.3476-1.3489. However, this signal did not generate any profits or losses for traders, as movement within the price range was virtually absent. The flat trend on the hourly timeframe continues.
On the hourly timeframe, the GBP/USD pair continues to form an upward trend but has been within the sideways channel of 1.3475-1.3587 for a week. There are no significant grounds for a medium-term rise in the dollar, so we expect the resumption of the global upward trend of 2025 in 2026. For this to happen, geopolitical tensions worldwide must continue to ease. However, currently, the market is in a suspended state, as there is no specific information available. In any case, we believe that without a serious escalation in the Middle East, the dollar will no longer be able to sustain the growth it has shown over the last two months. At the same time, individual events may still provoke their strengthening.
On Thursday, beginner traders may open short positions if the price consolidates below the 1.3476-1.3489 area, targeting 1.3380-1.3386. A price bounce from the area of 1.3476-1.3489 will allow for new long positions with targets of 1.3587-1.3598.
On the 5-minute timeframe, levels to trade include 1.3175-1.3180, 1.3259-1.3267, 1.3319-1.3331, 1.3380-1.3386, 1.3476-1.3489, 1.3587-1.3598, 1.3695, 1.3741-1.3751. Today, indices of business activity will be published in the UK and the US; however, it is worth recalling that the market has already ignored much more significant reports on inflation and unemployment in the UK earlier this week.
Price levels of support and resistance are levels that serve as targets when opening buys or sells. Take Profit levels can be placed around them.
Red lines represent channels or trend lines that show the current trend and indicate the direction in which it is preferable to trade now.
The MACD indicator (14,22,3) – the histogram and the signal line – is a supporting indicator that can also be used as a source of signals.
Important speeches and reports (always included in the news calendar) can significantly affect the movement of the currency pair. Therefore, during their release, trading should be done with utmost caution, or traders should exit the market to avoid sharp price reversals against the previous movement.
Beginning traders in the forex market should remember that not every trade can be profitable. Developing a clear strategy and effective money management are the keys to long-term trading success.
*تعینات کیا مراد ہے مارکیٹ کے تجزیات یہاں ارسال کیے جاتے ہیں جس کا مقصد آپ کی بیداری بڑھانا ہے، لیکن تجارت کرنے کے لئے ہدایات دینا نہیں.
InstaSpot analytical reviews will make you fully aware of market trends! Being an InstaSpot client, you are provided with a large number of free services for efficient trading.


